
Please give me some feedback on my IELTS Writing Task 1. Thanks!
The charts summarize the weight measurements of people living in Charlestown in 1955 and 2015.
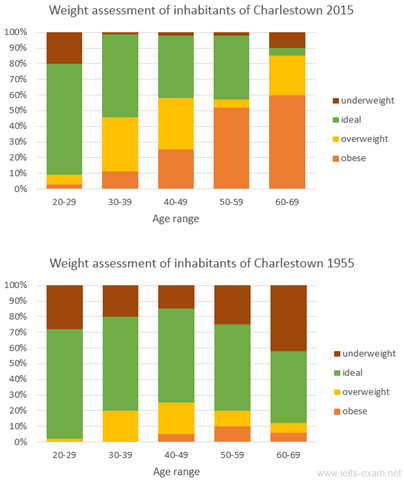
The bar chart compares the weight status of Charlestown inhabitants of different age groups in the years 2015 and 1955.
Overall, in 2015, a majority of people living in Charlestown suffered from overweight and obesity; the seriousness coincided with aging. By contrast, most inhabitants 60 years ago had relatively ideal weight.
In 2015, seven in ten people of the youngest age range were assessed as having perfect weight, but this proportion decreased markedly in the older age groups, with merely 5% of people aged 60-69. This is owing to a substantial increase in the overweight and obesity rate, almost 85% of the 60-69 age range faced this problem, compared to just a tenth of young adults. Meanwhile, underweight recorded marginal percentages, with the highest of 20% of the age bracket 20-29, followed by 10% of the oldest age group.
In 1965, the proportion of people having ideal weight was the same as that in 2015, but it did not vary much among the five age groups, ranging between 50% and 70%. As opposed to the year 2015, underweight was quite common, with the highest value of approximately 43% of old adults and the lowest of 15% of middle-aged adults. Whereas, overweight occurred the most in the age brackets 30-39 and 40-49 (20% each) while a minority of people aged 40+ suffered from obesity.
Top answer
mytraa The bar chart Is there only ONE bar chart? Look very very carefully. What kind of bar chart is it?
- mytraa The bar chart Is there only ONE bar chart?
- Look very very carefully.
- What kind of bar chart is it?
- Read my advice!
- Here are some pictures.
Get the Weekly English Kit 📬
New words, one handy idiom, and a 2-minute quiz — delivered to your inbox to keep your streak alive.
The bar chart compares the weight status of Charlestown inhabitants of different age groups in the years 2015 and 1955. (see the sample below. You did not describe this well. )
Overall, in 2015, a majority of people living in Charlestown (you do not need to repeat this. It is in the first paragraph.) suffered from
 Related Questions