
Please give me some feedback on my IELTS Writing Task 1. Thanks!
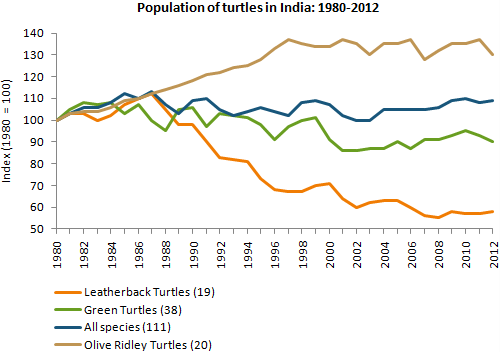
The line graph compares the population of turtles in India for four categories, namely Leatherback Turtles, Green Turtles, Olive Ridley Turtles between 1980 and 2012.
Overall, the starting points of these all kinds were the same; however, the situation at the end of the period was totally different. Leatherback Turtles and Olive Ridley Turtles showed the biggest difference, with the former rising markedly and the latter was opposite.
Olive Ridley Turtles increased by half to almost 140 units in 1997, compared to 100 at the beginning, and then fluctuated between 130 and 140 for the rest of the period. Conversely, the trend line for Leatherback Turtles was negative, which took a plunge to merely under 60 in the final year, despite reaching a peak of 110 in 1987.
Meanwhile, there were negligible changes in the total number of species and Green Turtle, although variations were visible. All species ranged from 100 to 110, while Green Turtle from 100 to 90 over the 22 years, finishing at 109 and 90 respectively.
Get the Weekly English Kit 📬
New words, one handy idiom, and a 2-minute quiz — delivered to your inbox to keep your streak alive.
 Related Questions