
Please give me some feedback on my IELTS Writing Task 1. Thanks!
The line graph illustrates the proportion of total expenditure in a certain European country between 1960 and 2000.
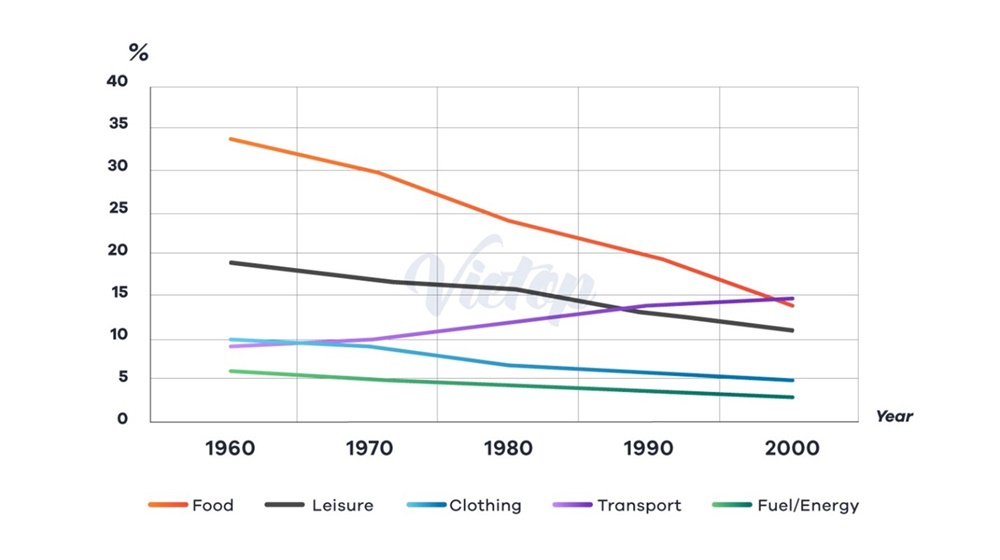
The line graph compares the percentage of total spending on five categories, namely food, leisure, clothing, transport and fuel/energy in a certain European nation over the period of four decades starting from 1960.
Overall, allocations for food, leisure, clothing and fuel/energy showed a downward trend over the period, while for transport, it rose significantly. At the start of the time frame, food expenses registered the highest figure; however, being replaced by transport in the final year.
In 1960, more than one-third of total expenditure was diverted to food, almost doubling that of leisure and quadrupling that of transport. Food and leisure expenses followed a similar trajectory over the whole course, declining progressively and finishing at roughly 14% and 11% in 2000. Likewise, there was a substantial increase in the spending on transport, which exceeded leisure’s percentage in 1990 and eventually hit a high of around 15% in 2000.
Regardings clothing and fuel/energy, their proportions stood at about 10% and 6% respectively in the first year. Both recorded a moderate fall, with clothing reduced by half and fuel/energy dropped by merely 3% in expenditure at the end of the timescale.
Top answer
Can you please check this essay and give me some feedback
- Can you please check this essay and give me some feedback
Get the Weekly English Kit 📬
New words, one handy idiom, and a 2-minute quiz — delivered to your inbox to keep your streak alive.
 Related Questions