
Please give me some feedback on my IELTS Writing Task 1 2. Thanks!
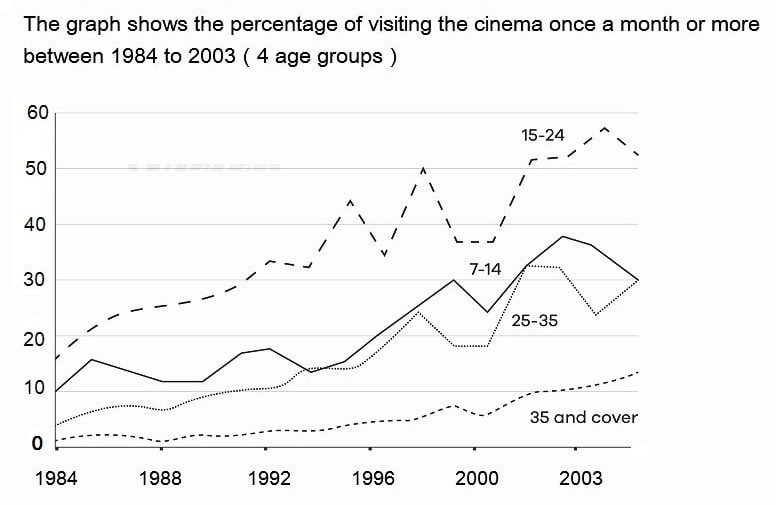
The line graph compares the percentages of cinema visitors aged 7 to over 35 at least once a month during the period of 20 years starting from 1984.
As can be inferred from the graph, it is evident cinema was preferred among the age group of 7 to 35, which revealed considerable increases with some marked variations. In the interim, people aged 35 or older experienced a moderate rise and accounted for less proportion of cinema attendance per month.
In 1984, the percentages of filmgoers aged 15 to 24 and 25 to 35 stood at around 16% and 5% respectively. After growing progressively until 1992, these fluctuated wildly and ultimately reached nearly 51% and 30% at the end of the period. The proportion of children going to the cinema witnessed a wild oscillation during the whole span, reaching 30% in 2003, as much as that of 25 to 35 age group and exactly tripled that of 1984.
Regarding for people aged 35 or more, it was only a tiny minority, hovering at approximately 2% in the first 8 years. Then for the rest of the time frame, there was a gradual improvement of roughly 10% with a slight fluctuation in 2000. Finally, it still remained the least popular audience of cinema.
Top answer
Please read my advice for Task 1 essays: IELTS TASK 1: Hints, Tips And Advice Vocabulary Words For Task 1: Reference Post
- Please read my advice for Task 1 essays: IELTS TASK 1: Hints, Tips And Advice Vocabulary Words For Task 1: Reference Post
Get the Weekly English Kit 📬
New words, one handy idiom, and a 2-minute quiz — delivered to your inbox to keep your streak alive.
The line graph compares the percentages of cinema visitors aged 7 to over 35 (That is not correct. This would be one line on a graph We do not "visit" a cinema. We go there to watch a movie..) at least once a month during the period of 20 years starting from 1984.
As can be inferred from the graph, it is evident (Do not
The line graph plots the percentage of people in four age groups, children 7-14, adolescents, 15-24, young adults 25-35 and adults over 35, who went to the movies once a month or more between 1984 and 2000.
Overall, the percentages increased in all age groups over this 16-year period, with the adolescents showing the greatest difference, and the adults the least.
 Related Questions