
PLEASE GIVE ME SOME FEEDBACK AND MY SCORE!!!THANK YOU SOO MUCH!!!
Topic: The chart below shows the results of a survey about people' coffee and tea buying and drinking habits in five Australian cities.
Summarise the infomation by selecting and reporting the main features,and make comparisons where relevant.
HERE IS MY ESSAY:
The given chart illustrates the surveyed results about people's consuming habits of two beverages in different Australian urban areas.
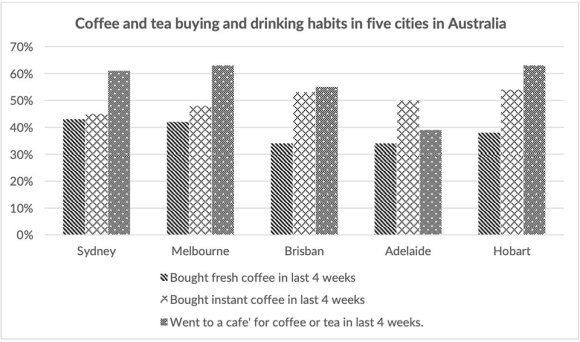
Overall, going to cafe for coffee or tea is the most popular choice in most cities, except Adelaide. The recorded number during the same period of time also reveals that the city dwellers prefer instant coffee than the the fresh ones.
Looking at the chart for more details, it is obvious that about 64% of Melbourne's residents going to coffee shops,and this number was slightly higher to the figure for Hobart and Sydney. Bisrbane is comparabably high with about 55%, followed by Adelaide with around 49% which is the only city where this category was not the highest. Meanwhile, fresh coffee accounts for the lowest proportion of consumers in all the cities.The figures for Sydney,Melbourne and Hobart are 44%,43% and nearly 40% respectively.Brisbane and Adelaide share the similarity in the level of preference with approximately 35%.
Turning to instant coffee, this product is the favourite choice in Adelaide with 50% whilst Hobart records the highest number among five cities(54%).Moreover, there is only just about 45% of people choosing instant coffee in Sydney during tha last four weeks while the figures for Melbourne and Brisbane was 5% and nearly 10% higher respectively.
Top answer
Please read my advice for Task 1 essays, so you understand what words you are not using correctly and the phrases without any information that should be deleted. IELTS TASK 1: Hints, Tips And Advice Vocabulary Words For Task 1: Reference Post
- Please read my advice for Task 1 essays, so you understand what words you are not using correctly and the phrases without any information that should be deleted.
- IELTS TASK 1: Hints, Tips And Advice Vocabulary Words For Task 1: Reference Post
Get the Weekly English Kit 📬
New words, one handy idiom, and a 2-minute quiz — delivered to your inbox to keep your streak alive.
Please read my advice for Task 1 essays, so you understand what words you are not using correctly and the phrases without any information that should be deleted.
You have a lot of spacing errors. Put a space after the ending punctuation before you begin a new sentence.
The given chart illustrates the surveyed results about people's consuming habits of t
This sample essay is much too long (270 words), but it will give you ideas on how to write this type of essay and avoid repetition.
Outline:
Paragraph 1: Describe the figure and all its attributes. Do not mention any of the data content.
Paragraph 2: Pick out 2 or 3 main features.
Paragraph 3: Write about a few details. Focus on comparing and contrasting the different categ
 Related Questions