
Please give me some comments on my task 1 writing
Task 1:
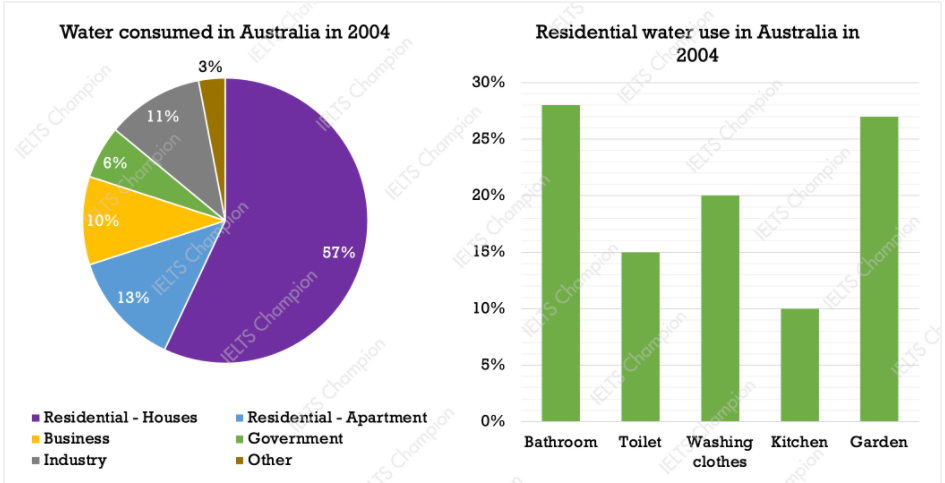
The charts below show information about water consumption in Australia in 2004 and how residential water was consumed in the same year. Summarize the information by selecting and reporting the main features and make comparisons where relevant.
HERE'S MY WRITING:
The pie chart given compares the proportion of water usage in 6 sections: houses, apartments, business, government, industry and other; and the bar graph describes the percentage of water used in residential areas for 5 different purposes: bathroom, toilet, clothes, clothes washing, kitchen and garden. All data were taken in Australia in 2004. In general, the largest amount of water was used by the residents. Meanwhile, bathrooms accounted for the biggest usage among accommodations.
With the highest percentage of 57%, water used in houses was then followed by that of apartments, 13%. The water usage of business and industry were nearly the same, at 10% and 11% respectively. In contrast, the volume of water used for other purposes took only a mere 3% of the all categories, which was a half of the government’s usage.
People in Australia spent the largest amount of water for bathrooms(26%), while the highest proportion belonged to gardens in this country(24%). 15% of housing water was used for toilets. In addition, there was 20% of water used for washing clothes, which was double that of kitchens.
(183 words)
Top answer
Please read my advice for Task 1 essays. I posted these links for you earlier, but you didn't read them, or didn't understand them. IELTS TASK 1: Hints, Tips And Advice Vocabulary Words For Task 1: Reference Post
- Please read my advice for Task 1 essays.
- I posted these links for you earlier, but you didn't read them, or didn't understand them.
- IELTS TASK 1: Hints, Tips And Advice Vocabulary Words For Task 1: Reference Post
Get the Weekly English Kit 📬
New words, one handy idiom, and a 2-minute quiz — delivered to your inbox to keep your streak alive.
Please read my advice for Task 1 essays. I posted these links for you earlier, but you didn't read them, or didn't understand them.
The pie chart given (The examiner know what pie chart you are writing about. "Given" is unnatural here.) compares the proportion of water usage in six types of usage 6 sections: (Use words for small numbers that are NOT data values. Section is not a good word.) houses
 Related Questions