
Please give me feedback on my IELTS Task 1: pie chart
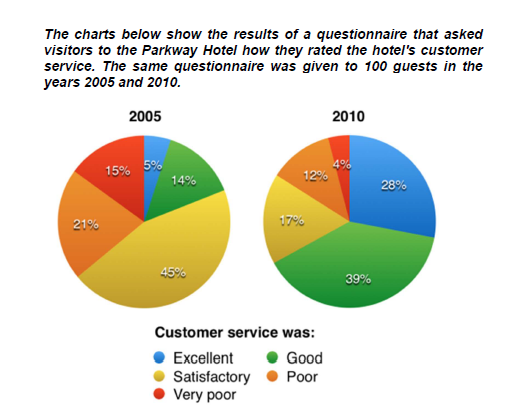
The pie charts given compare visitors’ responses to a survey about customer service at the Parkway Hotel in 2005 and 2010. There are five evaluation levels from the best to the worst, including excellent, good, satisfactory, poor, and very poor, respectively.
In general, Parkway Hotel’s customer service had significantly improved after 5 years. While most hotel guests rated customer service as satisfactory or poor in 2005, a large proportion of answers described the hotel’s service as good or excellent in 2010.
With regard to negative responses first, satisfaction was the most popular choice chosen by visitors in 2005, accounting for 45% of the total answers, almost three times higher than that in five years later. Similarly, the percentage of guests rated very poor and poor levels both experienced a 9% decrease between 2005 and 2010.
Looking at the positive feedback, the total percentage of good and excellent responses by customers in 2005 was less than a fifth, however, it then rose to 67% of responses in 2010. "Good" is the most popular choice by guests in 2010, at under 40%, followed by "excellent" answers, at nearly 3 in 10.
Top answer
) pie charts given (Do not use "given", "provided", "above" or "below". ) compare visitors’ responses to a survey about customer service at the Parkway Hotel in 2005 and 2010 given to 100 guests . There are five evaluation levels from the best to the worst were including ("including" means that your list is incomplete..
- ) pie charts given (Do not use "given", "provided", "above" or "below".
- ) compare visitors’ responses to a survey about customer service at the Parkway Hotel in 2005 and 2010 given to 100 guests .
- There are five evaluation levels from the best to the worst were including ("including" means that your list is incomplete..
- ) excellent, good, satisfactory, poor, and very poor, respectively .
- (Respectively is used when you have two separate lists, and want to match them one-for-one.
Get the Weekly English Kit 📬
New words, one handy idiom, and a 2-minute quiz — delivered to your inbox to keep your streak alive.
The (how many?) pie charts given (Do not use "given", "provided", "above" or "below". ) compare visitors’ responses to a survey about customer service at the Parkway Hotel in 2005 and 2010 given to 100 guests. There are five evaluation levels from the best to the worst were
 Related Questions