
Please give me feedback on my IELTS Task 1: Line graph
The graph below shows the average number of UK commuters travelling each day by car, bus or train between 1970 and 2030. Summarise the information by selecting and reporting the main features, and make comparison where relevant. Write at least 150 words.
Paragraphs:
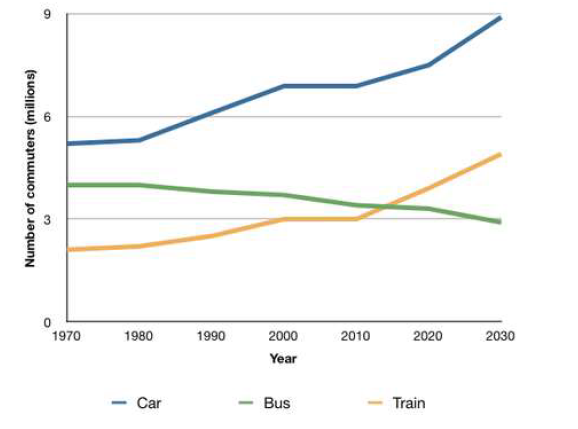
The line graph given provides data about the use of three forms of transport, (car, bus and train) over a 60 year period by workers in the UK. Units are given as the number of workers each kind uses per day.
Overall, all types of transport remained fairly stable in the initial interval, from 1970 to 1980. After that, while cars and trains have shown an upward trend in use, the number of bus users has fallen steadily.
With regard to cars, they have been the most popular transport used by UK workers over a period of 60 years, from around 5 million users in 1970 to 9 million users in 2030. Likewise, the number of UK commuters using trains was only above 2 million in 1970 before gradually increasing to a plateau in 2000. Then, this is predicted to significantly increase over the next 20 years, becoming the second most popular transport.
On the contrary, the bus was the second popular transport option for UK workers in 1970, with the number of passengers being two times higher than that of trains. However, in the following years, the number of UK workers using it has shown a downward trend and is predicted to be the least used transport in 2030, with approximately 3 million passengers per day.
Get the Weekly English Kit 📬
New words, one handy idiom, and a 2-minute quiz — delivered to your inbox to keep your streak alive.
 Related Questions