
Please finding the mistake in my essay. Thank you so much
Questions:
The pie charts below show the most common advantages and disadvantages of Bowen Island, according to a survey of visitors.
Summarise the information by selecting and reporting the main features, and make comparisons where relevant.
Answer: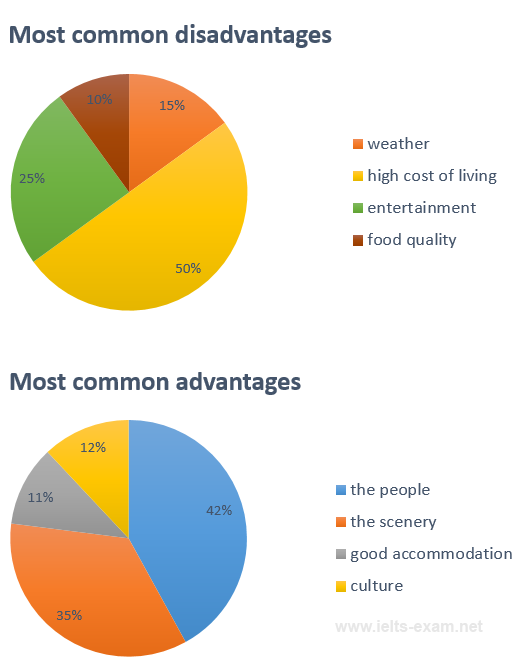
The pie graph predicts the opinions of visitors about popularly positives and negatives of Bowen Island.
Overall, according to the survey, some things as the people, the scenery, the culture, and accommodation have attracted the tourist in Bowen Island. Besides that, the weather, cost of living, entertainment and food quality in Bowen Island are some negatives to the tourist.
The highest percentage of disadvantages in Bowen Island is 50% of the high cost of living. A quarter of the pie chart is occupied by entertainment. The last quarter is shared with 2 parts as cuisine and the weather of 10% and 15% respectively. Nevertheless, the tourist is attracted by the local people in Bowen Island, which’s cited 42% of the tourist to agree about it. The second area citing more than a third is scenery. The good apartment and culture on Bowen Island are equivalently cited by 11% and 12% respectively.
Top answer
The pie graph predicts (Wrong word. It is not a prediction. ) the opinions of visitors about popularly (wrong word) positives and negatives of Bowen Island.
- The pie graph predicts (Wrong word.
- It is not a prediction.
- ) the opinions of visitors about popularly (wrong word) positives and negatives of Bowen Island.
- (Your first paragraph is inadequate.
- How many pie charts are there?
Get the Weekly English Kit 📬
New words, one handy idiom, and a 2-minute quiz — delivered to your inbox to keep your streak alive.
The pie graph predicts (Wrong word. It is not a prediction. This is actual survey results.) the opinions of visitors about popularly (wrong word) positives and negatives of Bowen Island. (Your first paragraph is inadequate. How many pie charts are there? What is on each one. What are
 Related Questions