
Please evaluate this essay ! Thank you
The charts show the percentage of sales and profits of a British company by geographical area.
Summarise the information by selecting and reporting the main features, and make comparisons where relevant.
The pie charts reveal information about how a British company sold their products and made a profit in different places in the world namely the UK. Rest of Europe, the USA, and the rest of the World.
Overall, the percentage of sales in the UK and rest of the Europe were equal while in the USA the proportion of sales was similar to the profits. Moreover, the rest of the World made up a similar percentage in both sales and profits, which was also the lowest compared to the sales and profits of other countries and areas.
In detail, the sales in the UK and rest of Europe accounted for similar percentage when the profits of that countries made up 50% and 25% respectively, which was as twice as percentages. In the USA, the rate of sales and profits comprised equally 20%, combined with 5% in the proportion of that categories in rest of the World and took over a quarter of the gross revenue and profits.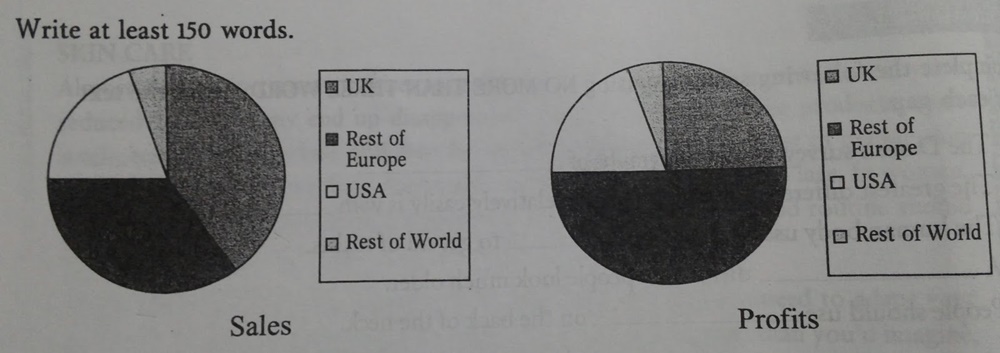
Top answer
The two pie charts give a breakdown of the profits and sales of a British company among four different world regions: reveal information about ("Information" is vague and imprecise. ) how a British company sold their products and made a profit in different places in the world namely the UK. r est of Europe, the USA, and the rest of the w orld.
- The two pie charts give a breakdown of the profits and sales of a British company among four different world regions: reveal information about ("Information" is vague and imprecise.
- ) how a British company sold their products and made a profit in different places in the world namely the UK.
- r est of Europe, the USA, and the rest of the w orld.
- Overall, the percentage of sales in the UK and rest of the Europe were about equal while in the USA the proportion of sales was similar to the profits.
- Moreover, the rest of the w orld made up a similar percentage in both sales and profits, which was also the lowest compared to the sales and profits of other countries and areas.
Get the Weekly English Kit 📬
New words, one handy idiom, and a 2-minute quiz — delivered to your inbox to keep your streak alive.
The two pie charts give a breakdown of the profits and sales of a British company among four different world regions: reveal information about ("Information" is vague and imprecise. What do these pie charts show?) how a Brit
 Related Questions