
Please evaluate my writing task 13.
The pie charts below show units of electricity production by fuel source in Australia and France in 1980 and 2000.
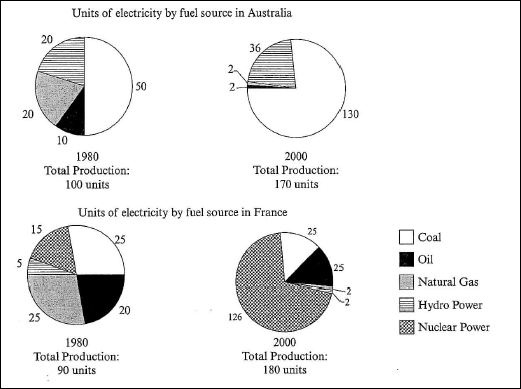
The four pie charts illustrate the production of electricity using five different sources of fuel in two nations ( Australia and France) over two separate years( 1980 and 2000).
Overall, the total production in both Australia and France rose dramatically from 1980 to 2000. While electricity production from coal was highest in Australia, the amount of electricity produced in 2000 in France was from nuclear power.
In Australia, about 50 of the total 100 units of electricity was produced from coal in 1980 and increasing more than doubble to 130 out of 170 units in 2000. Hydro power was used for just under 25% of its electricity in both years, around 20 and 36 out of the total production in 1980 and 2000 respectively. Australia depended on natural gas and oil for electricity production in 2000 was lower than onces in 1980.
In France, nuclear power became the most important fuel source in 2000, producing almost 70% of the country’s electricity and less electricity was produced than Austrilla. The amounts of coal and oil was almost equal and natural gas and nuclear power was lowest in two years.
Top answer
The four pie charts illustrate break down the total production of electricity by the using five different sources of fuel in two nations ( Australia and France) in over two separate year s( 1 980 and 2000). Five fuels are shown: coal, oil, natural gas, hydro power and nuclear power. Overall, the total production in both Australia and France rose dramatically from 1980 to 2000.
- The four pie charts illustrate break down the total production of electricity by the using five different sources of fuel in two nations ( Australia and France) in over two separate year s( 1 980 and 2000).
- Five fuels are shown: coal, oil, natural gas, hydro power and nuclear power.
- Overall, the total production in both Australia and France rose dramatically from 1980 to 2000.
- While electricity production from coal was highest in Australia in both years , the greatest amount of electricity produced in 2000 in France was from nuclear power.
- Better: While electricity production from coal was highest in Australia in both years, in France, there was no single dominant source in 1980, but nuclear power became the largest fuel source in 2000.
Get the Weekly English Kit 📬
New words, one handy idiom, and a 2-minute quiz — delivered to your inbox to keep your streak alive.
The four pie charts illustrate break down the total production of electricity by the using five different sources of fuel in two nations ( Australia and France) in over two separa
 Related Questions