
Please evaluate my writing ielts for task 1
Topic: The pie chart below shows the main reasons why agricultural land becomes less productive. The table shows how these causes affected three regions of the world during the 1990s.
Summarise the information by selecting and reporting the main features and make comparisons where relevant.
You should write at least 150 words.
-------------------------------------------
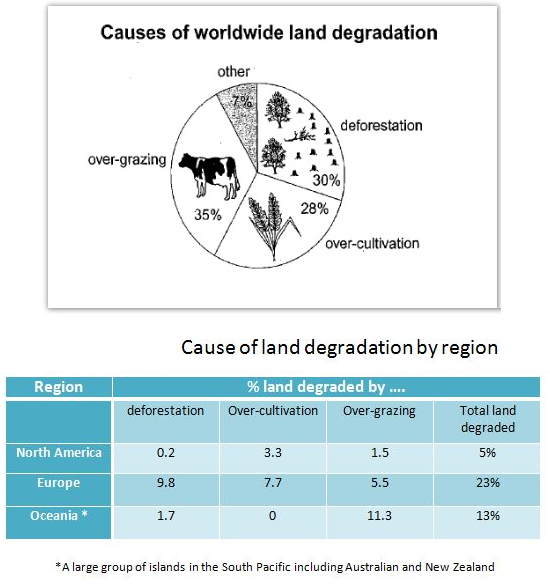
The pie chart illustrates the major causes of land degradation around the world and the table compares the influence of these causes on North America, Europe and Oceania between 1990 and 1999.
Overall, the main reason for agricultural land degradation in the world was the over-grazing of cattle. Moreover, Europe had the highest proportion of land degraded and it was caused mainly by deforestation.
During the 1990s, about 35% of the agricultural land was deteriorated by the over-grazing activities whereas the land degradation resulted from deforestation accounted for 30%. While over-cultivation stood at the third rank as a cause of degrading 28% of agricultural land, about 7% of land was degraded by other causes.
Europe and Oceania were damaged the most of the three regions, degrading around 23% and 13% of the agricultural land respectively. In Europe, deforestation was the primary cause of land degradation at 9.8% compared to 2% in North America. Over-cultivation was the second largest factor of land degradation in Europe with 7.7%. However, in Oceania, the over-cultivation hardly caused any influence on the farming land. While over-grazing had a slight impact (1.5%) on agricultural land in North America, it was the major cause of land degradation in Oceania, at 11.3%.
Top answer
The pie chart gives illustrates the three major causes of land degradation around the world and the table compares the influence percentage of land degraded per cause in of these causes on North America, Europe and Oceania between 1990 and 1999. These causes are deforestation. over-cultivation and over-grazing.
- The pie chart gives illustrates the three major causes of land degradation around the world and the table compares the influence percentage of land degraded per cause in of these causes on North America, Europe and Oceania between 1990 and 1999.
- These causes are deforestation.
- over-cultivation and over-grazing.
- Overall, the main reason for agricultural land degradation in the world was the over-grazing of cattle .
- Moreover, Europe had the highest proportion of land degraded and it was caused mainly by deforestation.
Get the Weekly English Kit 📬
New words, one handy idiom, and a 2-minute quiz — delivered to your inbox to keep your streak alive.
The pie chart gives illustrates the three major causes of land degradation around the world and the table compares the influence percentage of land degraded per cause in of these causes on North America, Europe and Oceania between 1990 and 1999.
 Related Questions