
Please evaluate my task 1 IELTS writing (Cambridge 15-test4)
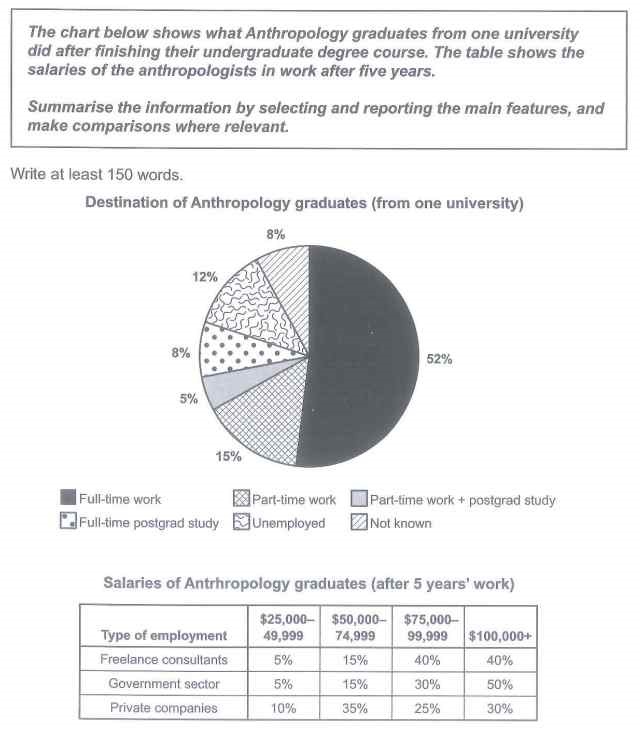
The pie chart illustrates the jobs chose by Anthropology students after their graduation from one university and the table provides information about the anthropologists’ income after five years of working.
Overall, most anthropology fresh graduates have full-time work and the highest payment (more than 100000 dollars) was received mostly by employees in the government sector after 5 years.
Looking at the pie chart, more than 50 percent of anthropology grads work as full-time staff after finishing their courses, which is nearly four times as high as those work part-time (15 percent). The share of unemployment ranks third with 12 percent. Those who enter full-time postgraduate study, work part-time combining with further education, and have unknown jobs only account for a modest proportion, less than a quarter in total.
Regarding the table, freelance consultants receive relatively high salaries after 5 years. 8 out of 10 people have more than 75000 dollars while only a fifth of them receive less than 75000 dollars. Similarly, workers in the government field are also paid in the same manner. In contrast, 55 percent of anthropologists who work for private companies get the payment of more than 75000 dollars and 45 percent of them earn less than 75000 dollars in salary after 5-year devotion.
Top answer
You did not read my advice, did you? htm
- You did not read my advice, did you?
- htm
Get the Weekly English Kit 📬
New words, one handy idiom, and a 2-minute quiz — delivered to your inbox to keep your streak alive.
You did not read my advice, did you?
https://www.englishforums.com/English/IeltsTaskHintsTipsAdvice/bxgnkx/post.htm
You need to pay more attention to the accuracy and precision of your statements.
The pie chart illustrates (wrong word - read my advice) the jobs (wrong word. Unemployment is not a job. Would a person chose to be unemployed after graduating?)
The pie chart illustrates the percentage of what Anthropology graduates from one university did after their graduation. The table reveals the earned income they make after 5 years’ work according to three kinds of employment. Overall, in the first graph, most of the graduates worked fulltime after finishing university while the table shows that those who rendered work for 5 years earn a differ
The pie chart illustrates what was done by graduates of anthropology at the completion of their undergraduate degree program from a particular university while the table provides information about the earnings of the anthropologists at the end of a five year work period. Overall, it can be seen that the percentage of graduates that did full time jobs were the highest and a greater proportion o
 Related Questions