
Please evaluate my task 1 IELTS writing (Cambridge 11-test 2)
The charts below show the proportions of British students at one university in England who were able to speak other languages in addition to English, in 2000 and 2010. Summarise the information by selecting and reporting the main features and make comparisons where relevant.
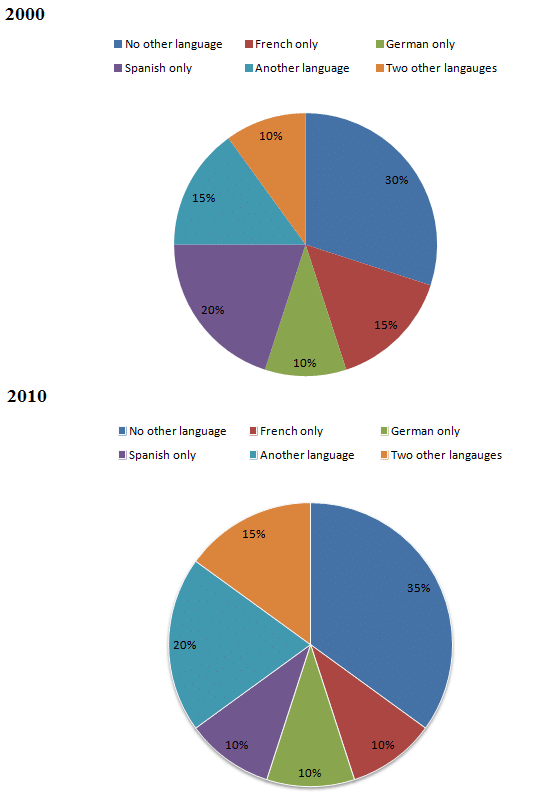
The pie charts compare the percentage of British students in a university who could communicate in foreign languages in two different years, 2000 and 2010.
In general, the vast majority was always held by students who spoke their mother tongue only. Moreover, in the given period, the change in the proportion of different student groups divided by their linguistic ability was very little, just less or equal to 5 percent.
In 2000, three out of ten students in the university were not capable of speaking any foreign language, which then increased by 5 percent in the next 10 years. Similarly, there was a 5 percent rise in the proportion of those who speak one or two other languages, from 15 to 20 percent and from 10 to 15 percent respectively.
In contrast, from 2000 to 2010, the percentage of people who can be engaged in Spanish or French communication declined by 5 percent, from 20 to 15 percent and 15 to 10 percent respectively. Over time, the share of German speakers remained unchanged, at 10 percent.
Top answer
The pie charts compare the percentage of British students in a university who could communicate in foreign languages in two different years, 2000 and 2010. In general, the [ 1] vast majority was always held by largest sector in both charts was the one representing students who spoke only their mother tongue , English. only.
- The pie charts compare the percentage of British students in a university who could communicate in foreign languages in two different years, 2000 and 2010.
- In general, the [ 1] vast majority was always held by largest sector in both charts was the one representing students who spoke only their mother tongue , English.
- only.
- Moreover, in the given period, the any change in the proportions of different student groups divided by their linguistic ability that did occur was very little, just less or equal to only 5 percent.
- In 2000, three out of ten students in the university were not capable of speaking any foreign language, which then and that proportion increased by 5 percent in the next 10 years.
Get the Weekly English Kit 📬
New words, one handy idiom, and a 2-minute quiz — delivered to your inbox to keep your streak alive.
The pie charts compare the percentage of British students in a university who could communicate in foreign languages in two different years, 2000 and 2010.
In general, the [ 1] vast majority was always held by largest sector in both charts was the one representing students who spoke only
 Related Questions