
Please Evaluate My IELTS Task 1 Essay (Pie Chart)
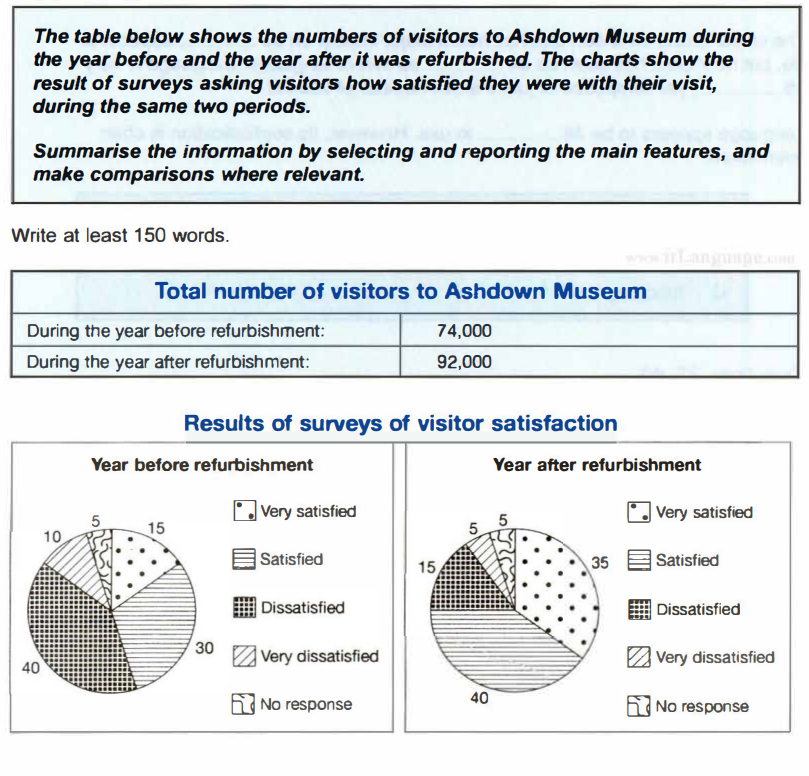
The two pie charts and the table show the total number of visitors to Ashdown Museum and the results of researches about people’s satisfaction during the year before and after the museum’s renovation.
Overall, after the refurbishment, there was a slight increase in the number of visitors and the proportion of people who were satisfied with the museum’s services also boosted dramatically.
The total number of people visited rose from 74.000 to 92.000 in one year before and after the Ashdown Museum’s upgrade. Before the renovation, only 45% of total visitors felt pleased with 15% of people very satisfied. The proportion of contented visitors was increased to 75% after the upgrade and nearly a half of them were very satisfied (35%).
Half of the total visitors were not pleased with the museum’s services before the refurbishment and 10% of the guest were very dissatisfied. However, after the renovation, the number of contented visitors decreased by 20% with only 5% of people very dissatisfied. And during the museum’s upgrade, the rate of visitors who hadn't responded to surveys was constant, at 5%.
Top answer
The two pie charts and the table show the total number of visitors to Ashdown Museum (The pie charts do not have numbers of visitors. Your writing is not clear. ) about people’s satisfaction (You did not describe this very well.
- The two pie charts and the table show the total number of visitors to Ashdown Museum (The pie charts do not have numbers of visitors.
- Your writing is not clear.
- ) about people’s satisfaction (You did not describe this very well.
- What was used to measure satisfaction?
- How many options did people have to chose from?
Get the Weekly English Kit 📬
New words, one handy idiom, and a 2-minute quiz — delivered to your inbox to keep your streak alive.
The two pie charts and the table show the total number of visitors to Ashdown Museum (The pie charts do not have numbers of visitors. Your writing is not clear. and the results of researches (wrong form and wrong word.) about people’s satisfaction (You did not describe this ver
The table and two pie charts together show the effects of a refurbishment project at the Ashdown Museum in terms of the numbers of visitors and their satisfaction levels. The table lists the number who came the year before and the year after the project. The two pie charts give the results of surveys in the same time periods, that is, the percentages of very satisfied, satisfied, dissatisfi
 Related Questions