
Please evaluate - IELTS writing task1
The charts below show the results of a survey about what people of different age groups say makes them most happy.
Summarise the information by selecting and reporting the main features, and make comparisons where relevant.
Write at least 150 words.
The two pie charts show different reasons which made people happy. The survey conducted consisted of participants of different age groups.
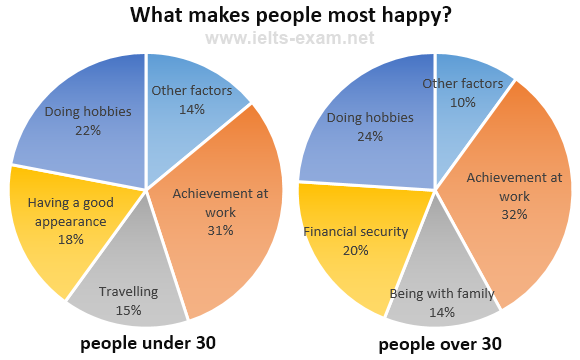
Almost equal number of people, aged below and above thirty think achievements at work and pursuing their hobbies gave them more happiness than any other reason.
About one in three people aged under thirty years felt happy by achieving at work and another 22% by engaging themselves in their hobbies. Having a good appearance made 18% young people happy and 15% of this age liked to travel for happiness. There were few other factors which made 14% of the people under 30 years happy.
Although more number of (32% and 24%) people over 30 years of age chose work achievement and pursuing hobbies as major reasons of their happiness, one in five people above 30 years took happiness in securing their financial status; unlike people under 30. Also, this age group showed a big contrast by not choosing to travel and choosing to be with family to be happy.
Top answer
The two pie charts show different the reason s, in five broad categories, which made people happy. The survey conducted consisted of asked participants of different in two age groups , people under thirty and those over thirty. An a lmost equal number of peopl e aged below and above in both age groups thirty think reported achievements at work and pursuing their hobbies gave them more happiness than any other reason.
- The two pie charts show different the reason s, in five broad categories, which made people happy.
- The survey conducted consisted of asked participants of different in two age groups , people under thirty and those over thirty.
- An a lmost equal number of peopl e aged below and above in both age groups thirty think reported achievements at work and pursuing their hobbies gave them more happiness than any other reason.
- About one in three people aged under thirty years felt happy by achieving at work and another 22% by engaging themselves in practising their hobbies.
- Having a good appearance made 18% young people of the people in the younger group the most happ y, and while 15% of people this age liked to travel for happiness.
Get the Weekly English Kit 📬
New words, one handy idiom, and a 2-minute quiz — delivered to your inbox to keep your streak alive.
The two pie charts show different the reasons, in five broad categories, which made people happy. The survey conducted consisted of asked participants of different in two age groups
 Related Questions