
Please correct my writing. Thanks a lot.
Answer
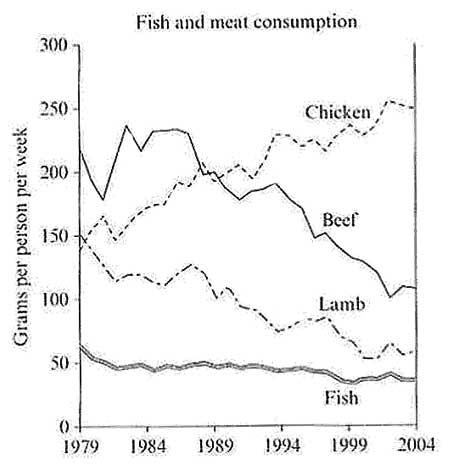
The line graph compares the amount of consumption of four different types of meat in a European nation during the 25 - year period from 1979 to 2004.
At first sight, it is clear that the usage of fish was the least among four types of food throughout the period. Additionally, the consumption of lamb, beef, and fish by people in a European country declined, whereas the figure for chicken increased.
At the start of 1979, beef was consumed the most, at about 220 grams per person per week. In the meantime, the figures for lamb, and chicken were much lower, at only less than 150 grams and exactly 150 grams respectively. On the other hand, fish consumption was the least with roughly 60 grams per week.
During the period from 1979 to 2004, this nation experienced dramatic growth in the expenditure on chicken to a peak of 250 grams. On the contrary, the consumption of lamb and fish at 50 grams and 40 grams respectively at the end of the period in 2004.
Despite the fact that beef consumption reached a peak of 240 grams in 1983, this figure then moderately drop to only 100 grams in 2004.
Top answer
The line graph compares the amount of c onsumption of four different types of meat in a European nation during the 2 5-y ear period from 1979 to 2004. At first sight, it is clear that the usage of f ish was the least consumed among the four types of food throughout the period. Additionally, the consumption of lamb, beef, and fish by people in that European country declined, whereas the figure for chicken increased.
- The line graph compares the amount of c onsumption of four different types of meat in a European nation during the 2 5-y ear period from 1979 to 2004.
- At first sight, it is clear that the usage of f ish was the least consumed among the four types of food throughout the period.
- Additionally, the consumption of lamb, beef, and fish by people in that European country declined, whereas the figure for chicken increased.
- At the start [ 1] of in 1979, beef was consumed the most, at about 220 grams per person per week.
- In comparison, the meantime, the figures for lamb, and chicken were much lower, at only less than 150 grams and exactly around [ 2 ] 150 grams each.
Get the Weekly English Kit 📬
New words, one handy idiom, and a 2-minute quiz — delivered to your inbox to keep your streak alive.
The line graph compares the amount of consumption of four different types of meat in a European nation during the 25-year period from 1979 to 2004.
At first sight, it is clear that the usage of fish was the least
 Related Questions