
Please correct my writing task 1. Many thanks!
The graph below shows the consumption of fish and some different kinds of meat in a European country between 1979 and 2004. Summarize the information by selecting and reporting the main features, and make comparisons where relevant.
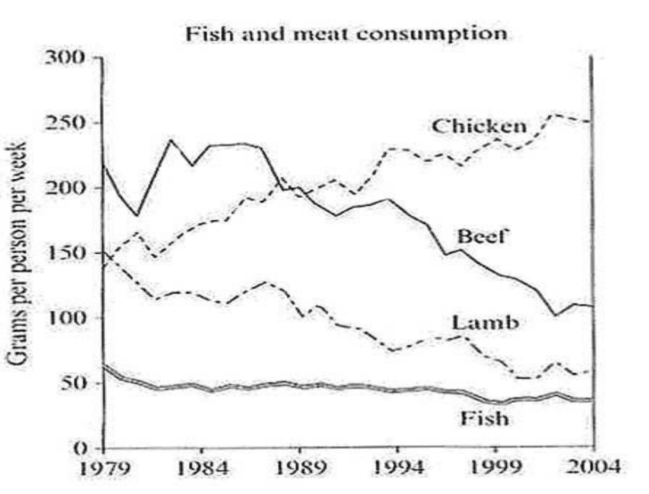
The line graph plots how many grams of fish and other kinds of meat namely chicken, beef, and lamb were consumed weekly by each person in a European nation between 1979 and 2004.
Overall, while the consumption of beef and lamb went through considerable declines with the exception of a slight stability in fish over the period covered, consumed grams of chicken had a dramatic decrease.
In detail, beef was considered the most favored meat in 1979, with the highest consumption of 220 grams compared to that of lamb as the second highest ( exactly 150 grams); however, it then wildly fluctuated and slipped to second place (nearly 110 grams) in 2004. Moreover, its trend was similar to lamb and fish, the consumption for fish decreased gradually from 60 grams in the first year to below 50 grams in 2004 as the lowest. Although it was in third place (140 grams) in 1979, the values for chicken then had serious fluctuations, reached a peak of 250 grams and ended up being the most popularly consumed meat in 2005, at 245 grams, which made a considerable gap with lamb of only 70 grams in the final year.
Top answer
The line graph plots how many grams of fish and other kinds of meat, namely chicken, beef, and lamb, were consumed weekly by each person in a European nation between 1979 and 2004. Overall, while the consumption of beef and lamb went through considerable declines , and fish changed very little. ) fish over the period covered , consumed grams (Unnatural) of But chicken had a dramatic decrease .
- The line graph plots how many grams of fish and other kinds of meat, namely chicken, beef, and lamb, were consumed weekly by each person in a European nation between 1979 and 2004.
- Overall, while the consumption of beef and lamb went through considerable declines , and fish changed very little.
- ) fish over the period covered , consumed grams (Unnatural) of But chicken had a dramatic decrease .
- ) In detail, beef was considered (wrong word.
- Describe the information) the most favored meat in 1979, with the highest consumption of 220 grams compared to that of lamb with as the second highest ( exactly 150 grams); however, it then wildly fluctuated and slipped to second place (nearly 110 grams) in 2004 .
Get the Weekly English Kit 📬
New words, one handy idiom, and a 2-minute quiz — delivered to your inbox to keep your streak alive.
The line graph plots how many grams of fish and other kinds of meat, namely chicken, beef, and lamb, were consumed weekly by each person in a European nation between 1979 and 2004.
Overall, while the consumption of beef and lamb went through considerable declines, and fish changed very little. with the exception of a slight stability in
Sample essay:
The line graph compares the amounts of beef, chicken, lamb and fish that people in a European country ate over the 25-year period, 1979 to 2004. The units of measure are grams per person per week (gm/week).
Overall, people consumed larger quantities in 2004 than they did in 1979, a total of about 570 gm/week in 2004 compared to 460 in 1979. That increase was
 Related Questions