
Please correct my writing task 1. Many thanks!
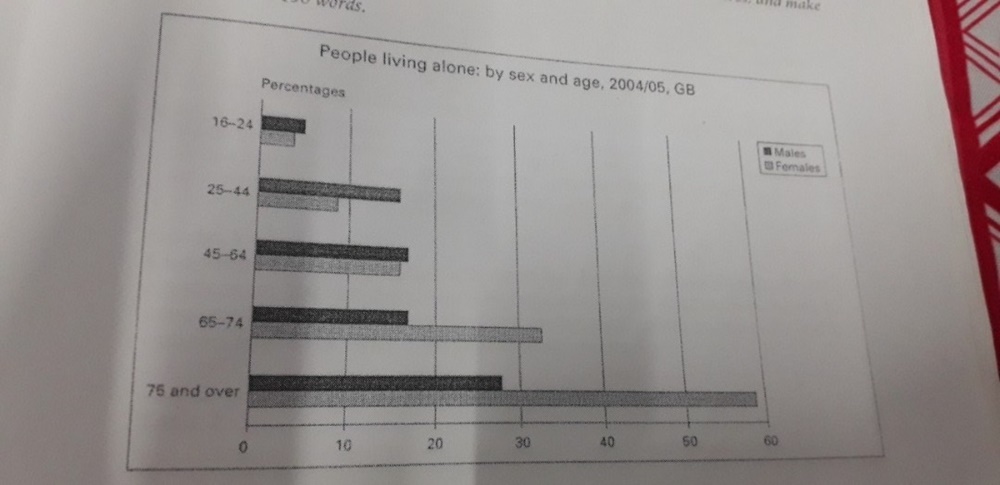
The bar chart below shows the percentage of people in Great Britain living alone by age and sex in 2004/2005. Summarize the information by selecting and reporting the main features, and make comparisons where relevant.
The horizontal bar chart compares proportions of single male and female citizens in five age groups, the young group 16-24, the two middle age groups, 25-44 and 45-64, and the other two senior brackets, 65-74 and older than 75 in Great Britain. Data is shown for two time points: 2004-2005.
Overall, men in the first three age ranges, 16-24, 25-44 and 45-64 had the higher percentages as opposed to those of women. Regarding the other two groups, 65-74 and over 75, conversely, their values for women were considerably larger than those for men.
In detail, females belonging to 65-74 and over 75 brackets accounted for 33% and nearly 60% respectively, which were half bigger than those of males, at 17% and 28%. However, it was a reverse for younger people, there were total proportions of mostly 35% for both men and women in 45-65 living alone, followed by those who are 25-44 and 16-24 with 24% and 9% respectively.
Top answer
The horizontal bar chart compares proportions of single British men and women who live alone male and female citizens (The task does not say that they were citizens. ) in five age groups, the a young group 16-24, the two middle age groups, 25-44 and 45-64, and the other two senior groups brackets , 65-74 and older than 75 in Great Britain . Data is shown for two time points : 2004-2005.
- The horizontal bar chart compares proportions of single British men and women who live alone male and female citizens (The task does not say that they were citizens.
- ) in five age groups, the a young group 16-24, the two middle age groups, 25-44 and 45-64, and the other two senior groups brackets , 65-74 and older than 75 in Great Britain .
- Data is shown for two time points : 2004-2005.
- (There are not any bars for 2004 and 2005 separately.
- ) Overall, men in the first three age groups / brackets ranges , 16-24, 25-44 and 45-64 had the higher percentages compared with the women.
Get the Weekly English Kit 📬
New words, one handy idiom, and a 2-minute quiz — delivered to your inbox to keep your streak alive.
The horizontal bar chart compares proportions of single British men and women who live alone male and female citizens (The task does not say that they were citizens. Single means "not married." It does not mean living alone.) in five age groups, the a young group
Sample essay:
The horizontal bar chart plots the percentages of men and women who live by themselves in Great Britain in 2004-2005. They are divided into five age groups, youth between 16 and 24, working-age adults (two groups 25-44 and 45-64), and two senior groups 65-74 and 75 or older.
Overall, in the three younger groups, there are higher percentages for men, but the opposite i
 Related Questions