
Please correct my writing task 1. Many thanks!
The chart shows the changes that took place in different areas of crime in Newport city centre from 2003-2012. Summarize the information by selecting and reporting the main features, and make comparisons where relevant.
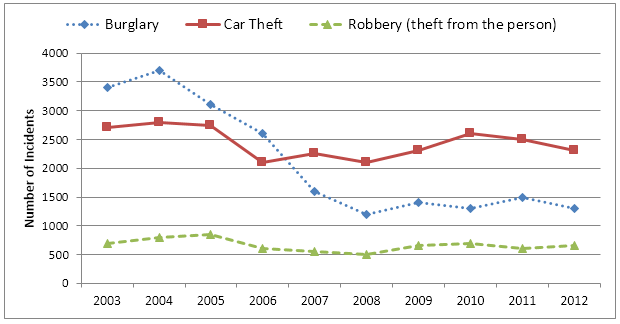
The line chart depicts varied rates of three criminal incidents, burglary, car theft and robbery, which occurred in three areas of the city center of Newport. Data is shown from 2003 to 2012.
Overall, the numbers of cases related to burglary had a downward trend over the period covered. Car theft and robbery, conversely, their rates remained unchanged between 2003 and 2012.
In detail, from 2003 to 2008, the quantity of burglary was highest (nearly 3400) in 2003 compared with other two categories, and peaked at 38000 cases in 2004; However, its values dramatically declined and slipped to second place, at 1200. Similarly, robbery and car theft shared the same downward pattern, the number of robberies was least (600) in 2003, reached a peak of mostly 1000 cases, and then decreased to 500 cases which were much lower than those of car thefts, at 2100 in 2008.
Additionally, from 2008 to 2012, there was a considerable increase in all categories, while car theft had the highest value of 3200 in 2012, numbers of crime scenes relevant to burglary and robbery were the second (1300) and the third place (600) respectively in the final year.
Get the Weekly English Kit 📬
New words, one handy idiom, and a 2-minute quiz — delivered to your inbox to keep your streak alive.
 Related Questions