
Please correct my writing task 1. Many thanks!
The pie charts below show the online shopping sales for retail sectors in New Zealand in 2003 and 2013. Summarize the information by selecting and reporting the main features, and make comparisons where relevant.
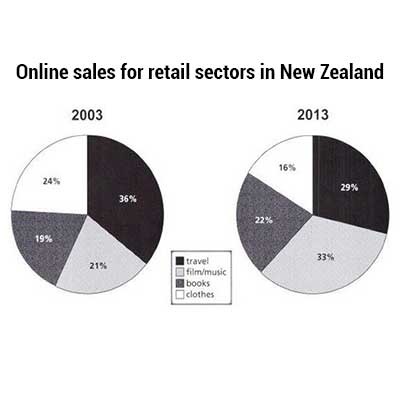
The two pie charts compare the proportions of online sales in New Zealand for four retail quarters, travel, film/music, books, and clothes. Data is shown for two time points: 2003 and 2013.
Overall, between 2003 and 2013, while there were larger percentages in the online selling of books, film and music, clothing trade and travelling went through declines in amount.
In detail, there was 36% of services dealt on travel in 2003, which was seen as highest compared with other categories; However, until 2013, this position was replaced by film and music sectors, which reached up to a hefty 33% in 2013 as opposed to 21% in 2013. Sharing the same pattern as film/music was books, its values rose slightly from 19% to 22% within a decade. Clothes, conversely, went downward in amount, starting as the second highest (24%) in 2003, but eventually money spent on them slipped to the least amount of value (roughly a quarter) in the second year, and there was also a decrease of 13% recorded in travel in 2013, at 29%.
Top answer
) compare the proportions of online sales in New Zealand for four retail categories quarters , travel, film/music, books, and clothes. Data is shown for two time points: 2003 and 2013. Overall, between 2003 and 2013, while there were larger percentages for two categories in the online selling of books, and film/music, clothing trade and travel ling were lower.
- ) compare the proportions of online sales in New Zealand for four retail categories quarters , travel, film/music, books, and clothes.
- Data is shown for two time points: 2003 and 2013.
- Overall, between 2003 and 2013, while there were larger percentages for two categories in the online selling of books, and film/music, clothing trade and travel ling were lower.
- went through declines in amoun t.
- In detail, there was 36% of total sales for services dealt on (unnatural) travel in 2003, which was seen as highest of the four compared with other categorie s.
Get the Weekly English Kit 📬
New words, one handy idiom, and a 2-minute quiz — delivered to your inbox to keep your streak alive.
The two pie charts, 2003 and 2013, (You can associate the time with each pie chart like this.) compare the proportions of online sales in New Zealand for four retail categories quarters, travel, film/music, books, and clothes. Data is shown for two time points: 2003 and 2013.
 Related Questions