
Please correct my writing task 1. Many thanks!
The chart below gives information about Southland’s main exports in 2000, *20…, and future projections for 2025.
Summarize the information by selecting and reporting the main features, and make comparisons where relevant. (*20..: for test purposes, use and refer to the current year).
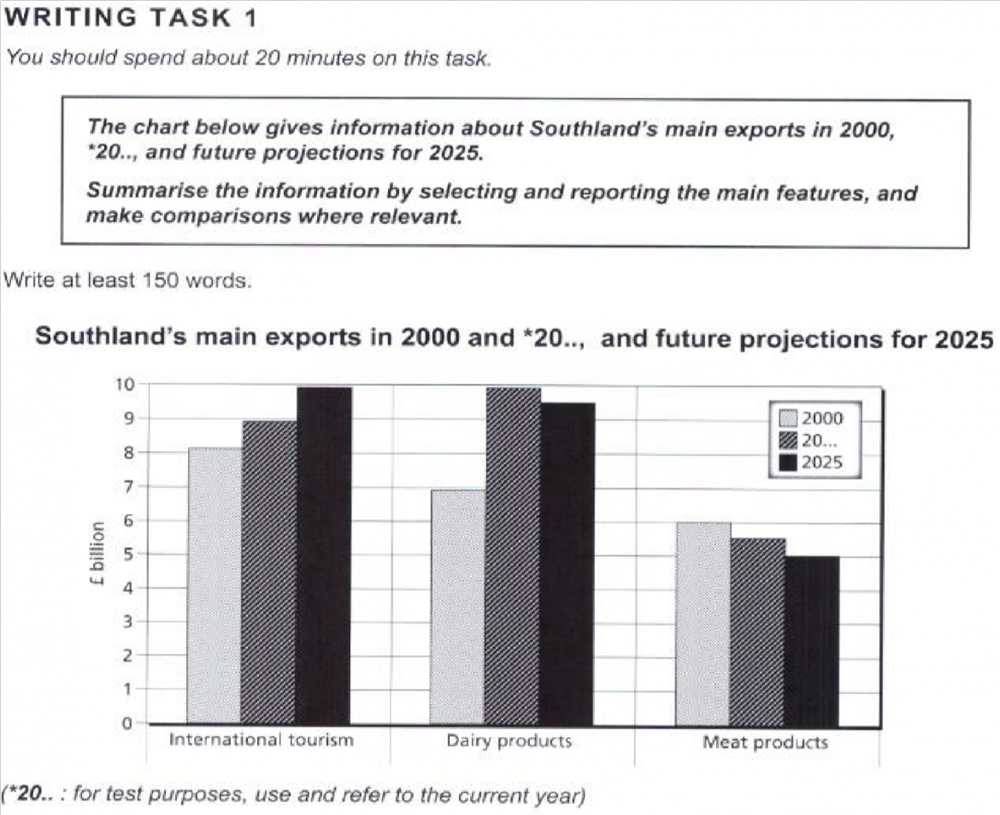
The grouped bars compare the exports of three main sectors, international, dairy products, and meat products in Southland between 2000 and 2021, and future estimation for 2025.
Overall, meat products were clearly exported the least in comparison to other two categories, and were expected to keep declining until 2025. By contrast, regarding exports from global tourism, its values had a steady increase within the years given.
In detail, there was a gradual drop in meat products exported; it initiated at exactly 6 billion pounds in 2000, which was 0.2 billion higher as opposed to that in 2021, and was forecast to be 5 billion pounds in 2025. With regards to international tourism, conversely, its data points climbed slightly from 8.1 billion pounds in 2000 to mostly 1 billion higher (nearly 9 billion) in 2021, and were estimated to continually rise up to 10 billion pounds within 4 years ahead. Between 2000 and 2021, exports of dairy products dramatically went up and reached the highest value of 10 billion pounds in 2021, which was over 3 billion higher than that in 2000 (7 billion), however, it was anticipated to go down merely in 2025, at 9.7 billion pounds.
Top answer
The grouped bar chart compares the exports of three main sectors (wrong word. ) , international , (International is an adjective. It is not a noun.
- The grouped bar chart compares the exports of three main sectors (wrong word.
- ) , international , (International is an adjective.
- It is not a noun.
- It is not a product that can be exported.
- This chart is tricky.
Get the Weekly English Kit 📬
New words, one handy idiom, and a 2-minute quiz — delivered to your inbox to keep your streak alive.
The grouped bar chart compares the exports of three main sectors (wrong word. ), international, (International is an adjective. It is not a noun. It is not a product that can be exported. This chart is tricky. You have to study these plots very very carefully, otherwise, you will go off in the w
 Related Questions