
Please correct my writing task 1. Many thanks!
The graph and the table below show the average monthly temperatures and the average number of hours of sunshine per year in three major cities. Summarize the information by selecting and reporting the main features and make comparisons where relevant.
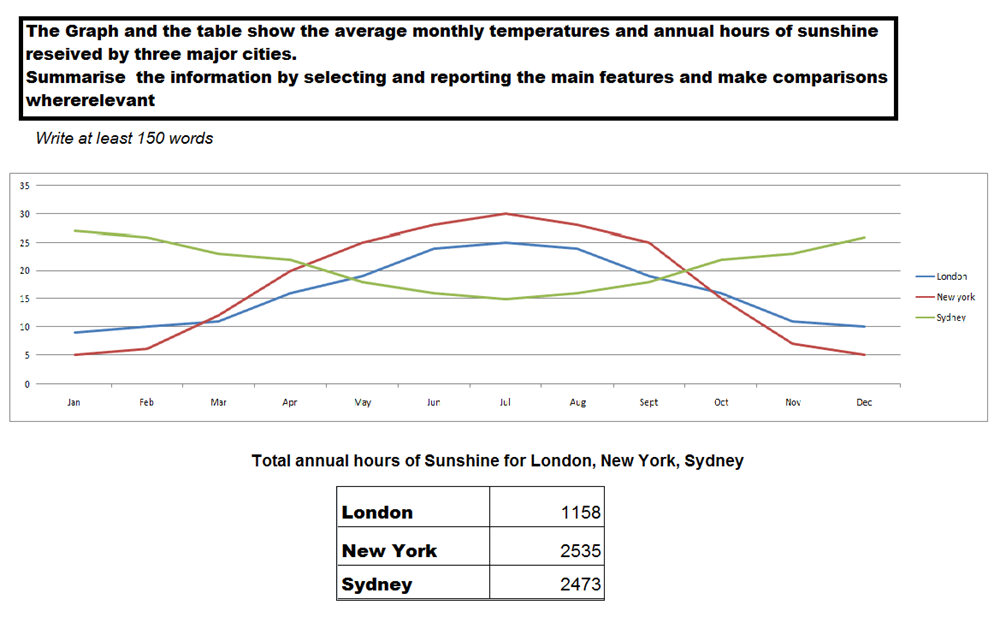
The chart and the table depict the changes of average temperatures, and the total hours of daylight in three metropolitan cities, London, New York and Sydney annually.
Overall, regarding the line graph, in Sydney, temperatures had a gradual downward trend in the first half of the year while New York and London experienced upward values. By contrast, whilst Sydney went through an increase in temperatures, London and New York had a reverse trend for the rest of the year.
In detail, for the table, the average sum of sunshine's hours in New York was ranked first (2,535 hrs), followed by Sydney and London, at 2,473 and 1,180 respectively.
Regarding the line chart, there was a wild fluctuation in Sydney’s temperatures, it began with the biggest temperature (25 degrees) compared with other two cities, hit bottom of 15 in July, and finally went through a significant increase to the same value in the final month. In Lon Don and New York, conversely, initiated as the second and third place, at 8 and 5 degrees respectively. Moreover, the temperatures of the two cities fluctuated throughout the year, their values climbed, reached two peaks of 30 and 23 in July, and eventually had dramatic decreases to the same beginning values in December.
Top answer
Read my advice for Task 1 essays. You need to stop making silly mistakes. IELTS TASK 1: Hints, Tips And Advice Vocabulary Words For Task 1: Reference Post If you would like a sample essay, you may ask for one.
- Read my advice for Task 1 essays.
- You need to stop making silly mistakes.
- IELTS TASK 1: Hints, Tips And Advice Vocabulary Words For Task 1: Reference Post If you would like a sample essay, you may ask for one.
Get the Weekly English Kit 📬
New words, one handy idiom, and a 2-minute quiz — delivered to your inbox to keep your streak alive.
Read my advice for Task 1 essays. You need to stop making silly mistakes.
IELTS TASK 1: Hints, Tips And Advice
Vocabulary Words For Task 1: Reference Post
If
The chart (wrong name.) and the table depict (not a good word choice) the changes of average temperatures, (incorrect. Please write exactly what is plotted. There are two items in the infographic. They are different formats and contain di
 Related Questions