
Please Correct my writing task 1
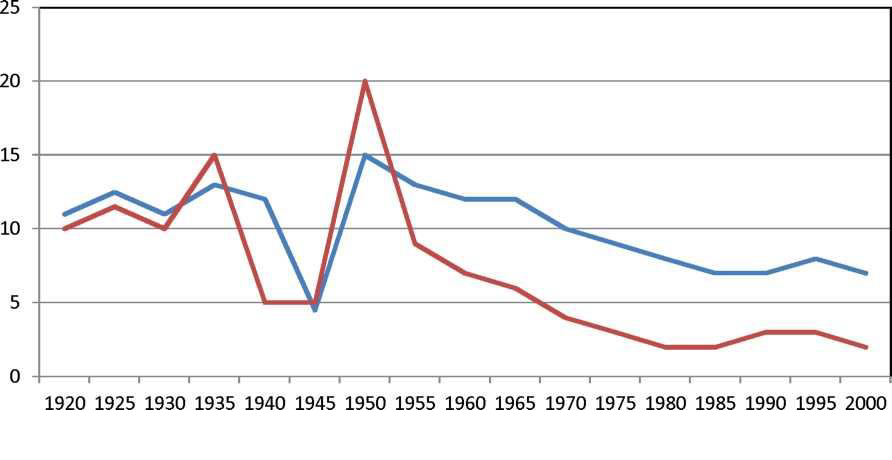
Note: the blue line is the US and the red one is China
The given line graph illustrates the birth rates of China and the USA over a period of time from 1920 to 2000.
Overall, as can be seen from the graph that there was a decrease in both China and the USA, however, China saw a lower drop than the USA.
At the start of the period, the birth rate of the USA is a shade higher than China, and then, it fluctuated within 20 years before diminishing significantly and hit the bottom at under 5 in 1945. However, it climbed considerably and reached a peak at 20 the 5-following year. After that, there was a gradual fall and finished at the figure which was half of the peak by the time 2000.
On the other hand, although China followed an identical trend as the USA throughout the whole period, the birth rate in China still had some differences. It peaked at 15 after 15 years and then dropped exponentially by 10% in 1940 before hitting the peak at 20 in 1950, which was 5% higher than the USA in the same period. However, China witnessed a dramatic decline to 2.5 at the end of the period.
Top answer
The given line graph illustrates plots the birth rates of China and the USA over a period of time from 1920 to 2000. Overall, as can be seen from the graph that there was a decrease in both China and the USA, however, China saw a lower drop than the USA. At the start of the period, the birth rate of the USA is a shade (Be precise; give a numerical value) higher than China, and then, it fluctuated within varied between 10 and ...
- The given line graph illustrates plots the birth rates of China and the USA over a period of time from 1920 to 2000.
- Overall, as can be seen from the graph that there was a decrease in both China and the USA, however, China saw a lower drop than the USA.
- At the start of the period, the birth rate of the USA is a shade (Be precise; give a numerical value) higher than China, and then, it fluctuated within varied between 10 and ...
- over the next 20 years before diminishing significantly and hit the bottom at under 5 in 1945.
- ) the 5-following (ungrammatical) year.
Get the Weekly English Kit 📬
New words, one handy idiom, and a 2-minute quiz — delivered to your inbox to keep your streak alive.
The given line graph illustrates plots the birth rates of China and the USA over a period of time from 1920 to 2000.
Overall, as can be seen from the graph that there was a decrease in both China and the USA, however, China saw a lower drop than the USA.
At the start of the period, the birth rate of the USA
 Related Questions