
Please correct my task 1. Thank you very much
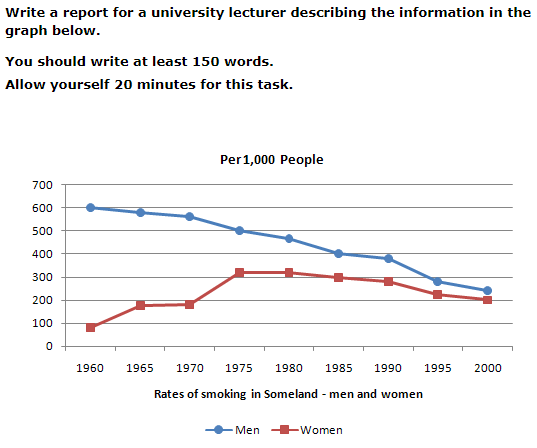
The line graph presents the number of smokers, men and women, for every 1,000 people in Someland from 1960 to 2000.
Overall, there was a major difference between the number of male smokers and female smokers at the beginning of the period, the gap was slowly narrowed down in 40 years when more men gave up smoking and more women adopted this habit.
In 1960, the number of male smokers in Someland was 600 persons for every 1,000 individuals, 6 times their counterpart. However, this declined to only 500 in 1975, while the number of female smokers tripled.
After 1975, there was still no sign of increasing male smokers as their number continued to drop by 50 every 5 years, resulting in the final statistic of around 250 per 1,000 male smokers in the year 2000. Their opposite also showed a similar trend as their number began to go down gradually to about 300 persons after 10 years and approximately 200 after another 15 years, 50 people less than the other gender.
(172 words)
Top answer
The line graph presents the number of smokers, men and women, for every 1,000 people in Someland from 1960 to 2000. Overall, there was a major difference between the number of male smokers and female smokers at the beginning of the perio d, (comma splice error) the gap was slowly narrowed down over these 40 years when smoking became less common among men and more prevalent among women. more men gave up smoking (Do not make any deductions, inferences or conclusions.
- The line graph presents the number of smokers, men and women, for every 1,000 people in Someland from 1960 to 2000.
- Overall, there was a major difference between the number of male smokers and female smokers at the beginning of the perio d, (comma splice error) the gap was slowly narrowed down over these 40 years when smoking became less common among men and more prevalent among women.
- more men gave up smoking (Do not make any deductions, inferences or conclusions.
- Maybe none of them gave up smoking.
- ) and more women adopted this habit.
Get the Weekly English Kit 📬
New words, one handy idiom, and a 2-minute quiz — delivered to your inbox to keep your streak alive.
The line graph presents the number of smokers, men and women, for every 1,000 people in Someland from 1960 to 2000.
Overall, there was a major difference between the number of male smokers and female smokers at the beginning of the period, (comma splice error) the gap was slowly narrowed down over these
 Related Questions