
Please correct my IELTS Writing Task 1 Essay
The table below shows how young people in Tokyo, Japan, listened to music over the previous month. The pie chart shows a record company's international findings about whether people preferred live or recorded music.
Summarize the information by selecting and reporting the main features, and make comparisons where relevant.
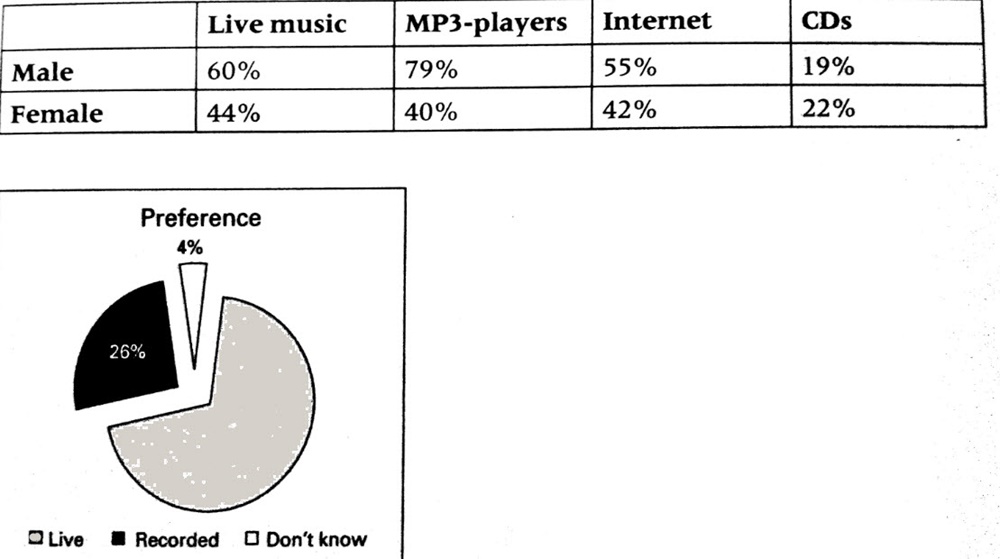
The table shows the proportions of young Japanese males and females who listened to music on MP3-players, online, on CDs and at concerts over the previous month. The pie chart illustrates the worldwide preferences, not divided by gender, for live and recorded music.
Overall, it is clear that the vast majority of people favoured live music over recorded music. In addition, the percentages of boys listening to music by all means were higher than those of girls, with the exception of CDs.
The pie chart shows that the proportion of people who preferred live music was almost triple that of ones favouring recorded music (70% compared to 26%), with the remaining 4% undecided. In terms of gender differences in listening habits, live music was predominant among females (44%), although it was still lower than the percentage of males who went to concerts (60%). As for men, the most common means to enjoy music was MP3-players (79%), which was nearly twice the figures for women.
Regarding the other two means that were used at lower levels, the proportion of males listening to music online, again, was higher than that of females (55% as opposed to 42%). In contrast, CDs witnessed a reverse pattern with 19% of boys in comparison with 22% of girls and were by far the least popular among both genders.
Thank you in advance!
Top answer
The table shows the proportions of young Japanese males and females who listened to music on MP3-players, online, on CDs and at concerts over the previous month. The pie chart gives illustrates the worldwide preferences, not divided by gender, for live and recorded music. ) favoured live music over recorded music.
- The table shows the proportions of young Japanese males and females who listened to music on MP3-players, online, on CDs and at concerts over the previous month.
- The pie chart gives illustrates the worldwide preferences, not divided by gender, for live and recorded music.
- ) favoured live music over recorded music.
- In addition, in Japan, the percentages of boys listening to music from all sources by all means were higher than those of girls, with the exception of CDs.
- The pie chart shows that the proportion of people who preferred live music was almost triple that of ones those favouring recorded music (70% compared to 26%), with the remaining 4% undecided.
Get the Weekly English Kit 📬
New words, one handy idiom, and a 2-minute quiz — delivered to your inbox to keep your streak alive.
The table shows the proportions of young Japanese males and females who listened to music on MP3-players, online, on CDs and at concerts over the previous month. The pie chart gives illustrates the worldwide preferences, not divided by gender, for live and recorded music.
Overall, it is clear that the vast majority of peopl
 Related Questions