
Please correct my IELTS Writing Task 1
The chart below shows the results of a survey about people’s coffee and tea buying and drinking habits in five Australian cities.
Summarise the information by selecting and reporting the main features, and make comparisons where relevant.
Write at least 150 words.
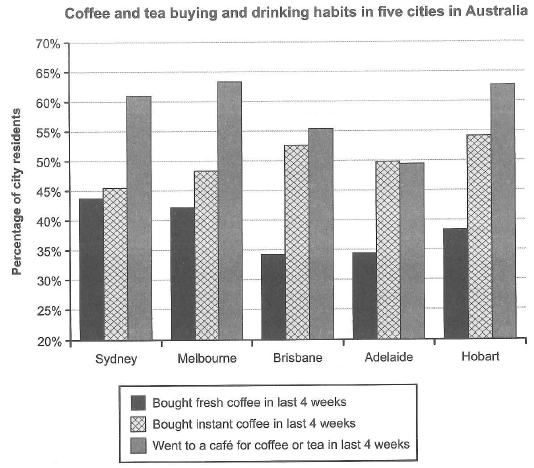
The bar chart compares the proportions of residents, who purchased fresh coffee, instant coffee and came to a cafe´ for coffee or tea in the last 4 weeks, of five Australian cities, namely Sydney, Melbourne, Brisbane, Adelaide and Hobart.
In general, much more than half of people surveyed in all of those cities went to a cafe´, with the exception of Adelaide. In addition, the percentage of people buying instant coffee was always higher than that of those purchasing fresh coffee.
In Sydney and Melbourne, the data registered quite similar patterns, with more or less 43% people purchasing fresh coffee and around 62% people coming to a cafe´ for coffee or tea. Whereas, the percentage of those who consumed instant coffee in Sydney was just over 45%, which was about 3% less than that of Melbourne.
In terms of three remaining cities, fresh coffee was purchased by approximately twenty-nine in a hundred residents of Brisbane and Adelaide, and by about thirty-eight per hundred people in Hobart. Additionally, in Brisbane and Hobart, there was about 53% people buying instant coffee, being 2% and 10% less than those of fresh coffee respectively. In Adelaide, the percentage of people who went to a cafe´ was approximately 49%, just a little less than that of those purchasing instant coffee.
I really appreciate your help.
Get the Weekly English Kit 📬
New words, one handy idiom, and a 2-minute quiz — delivered to your inbox to keep your streak alive.
 Related Questions