
Please correct my essay. Thank you!
----
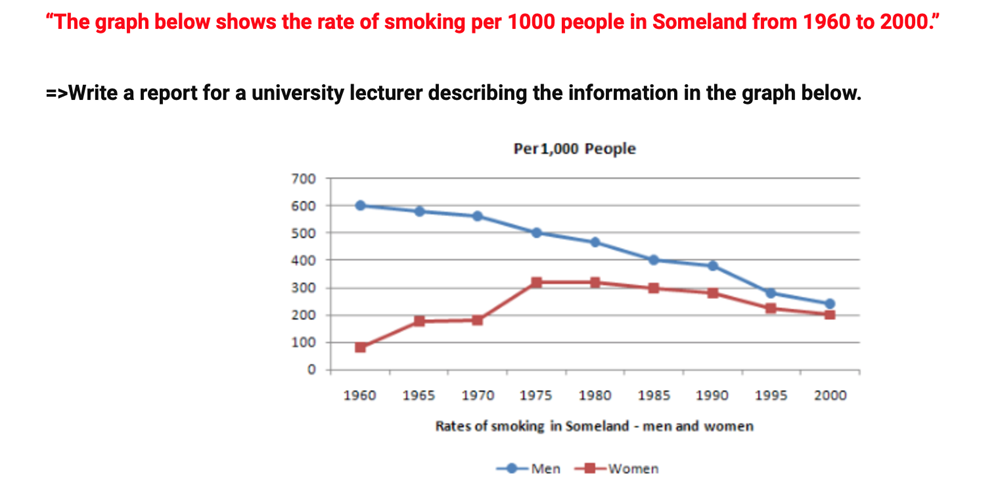
The line chart compares changes in smoking rate of men and women in Someland and how these rates changed between 1960 and 2000.
Overall, the rate of smoking both gender decreased over the period of 60 years. Although the two trends were similar in terms of a general decline, the smoking rate of men was higher than that of women.
From the highest point in 1960, the smoking rate of men started to decrease. Between 1970 and 2000, men's rate of smoking decreased rapidly by over 300 persons, falling to approximately 200 persons in 2000.
In comparison with the rate of smoking of men, that of women had a different trend. In the 1960 - 1975 period, the smoking rate of women increased continuously, to roughly 200 persons, which was its highest point during the 60-year period. However, from 1975 to 2000, the women's smoking rate had downward trend, dropping to 100 persons in 2000.
Top answer
Công Thành Phan The line chart compares changes in smoking rate of men and women in Someland and how these rates changed between 1960 and 2000. It is a chart, but you don't call it a "line" chart. It is a line graph.
- Công Thành Phan The line chart compares changes in smoking rate of men and women in Someland and how these rates changed between 1960 and 2000.
- It is a chart, but you don't call it a "line" chart.
- It is a line graph.
- "Between" suggests that the two years 1960 and 2000 are not included.
- The structure "from … to …" is better.
Get the Weekly English Kit 📬
New words, one handy idiom, and a 2-minute quiz — delivered to your inbox to keep your streak alive.
Công Thành Phan The line chart compares changes in smoking rate of men and women in Someland and how these rates changed between 1960 and 2000.
It is a chart, but you don't call it a "line" chart. It is a line graph. "Between" suggests that the two years 1960 and 2000 are not included. The structure "from … to …" is better. "And how these rates changed" is
Please post your essays just in the essay forum:
Thread Moved!
 Related Questions