
Please check this Task 1 essay
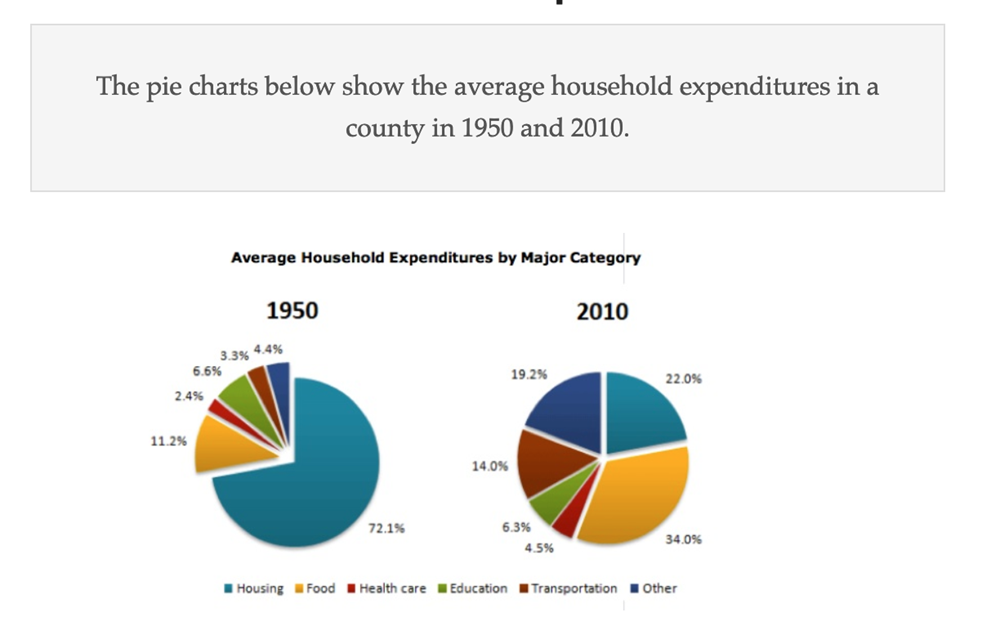
The pie chart depicts the average family spendings in a county in 1950 and 2010. The expenditures are divided into six categories ( Housing, Food, Health care, Education, transportation, Other).
Overall, from 1950 and 2010, there was a substantial reduction in the average family’s housing expenditure while for food, health care, transpoortation and other category, the reverse was true. The spendings on education were relatively similar and showed little difference over the two periods.
Around 72.1% of the average household expenditures in 1950 was for housing. However, this figure decreased by nearly a third in 2010 (22%). In contrast, the proportions for food, health care, transportation and other category saw a substantial rise between 1950 and 2010. Spendings on other category climbed approximately five times from 4.4% of the total expenditure in 1950 to about 19.2% in 2010. Significant increase was also seen in food (11.2% in 1950 to 34% in 2010) as well as transportation (3.3% in 1950 to 14%) and health care (2.4% to 4.5%).
With regard to education, the proportions of average household expenditure were relatively the same between 1950 (6.6%) and 2010 (6.3).
Top answer
The pie chart depicts the percentages of an average family 's expenditures divided into six budget categories spendings in a count y in 1950 and 2010. The expenditures are divided into six categories are Housing, Food, Health care, Education, transportation, and Other. Overall, from 1950 and 2010, there was a substantial reduction in the relative average family’s housing costs expenditure while for food, health care, transpoortation and other expenses, category , the reverse was true.
- The pie chart depicts the percentages of an average family 's expenditures divided into six budget categories spendings in a count y in 1950 and 2010.
- The expenditures are divided into six categories are Housing, Food, Health care, Education, transportation, and Other.
- Overall, from 1950 and 2010, there was a substantial reduction in the relative average family’s housing costs expenditure while for food, health care, transpoortation and other expenses, category , the reverse was true.
- The spendings (wrong form) relative spending on education were relatively similar and showed little difference over the two years.
- periods .
Get the Weekly English Kit 📬
New words, one handy idiom, and a 2-minute quiz — delivered to your inbox to keep your streak alive.
The pie chart depicts the percentages of an average family's expenditures divided into six budget categories spendings in a county in 1950 and 2010. The expenditures are divided into six categories are
 Related Questions