
Please check this for me I wrote it yesterday
The pie charts below show the average household expenditures in a country in 1950 and 2010. Summarise the information by selecting and reporting the main features, and make comparisons where relevant.
Write at least 150 words.
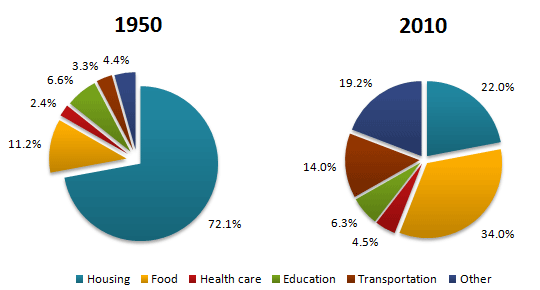
The pie charts depict the average amount of money citizens spent on different categories between 1950 and 2010.
Overall, it is immediately apparent that while housing was spent the most in 1950, food was the biggest segment in 2010. Additionally, all the figures witnessed dramatic changes during the given period, except for education and housing.
In 1950, housing made up the biggest part in the chart at 72.1%. Food ranks second in terms of expenditure. The amount of money spent on education was 6.6% while the figures for heath care, transportation and other were insignificant, at just under 5%.
In 2010, food expenditure headed the list with 34% while the spend on housing decreased by more than three times to 22%. The proportions of other and transportation soared overwheemingly, at 19.2% and 14% respectively. 6.3% of the expenditure was paid for food, compared to 4.5% of healthcare at the same time.
(153 words)
Top answer
Here are my suggestions: The pie charts depict the average amount of money citizens spent on different categories in between 1950 and 2010. [It is not between the two dates but on those two date s] The greatest o verall change , it is immediately apparent that while housing was the largest expenditure spent the most in 1950, food was became the biggest segment in 2010. Additionally, all the figures categories witnessed dramatic changes during the given period, except for education, which stayed in the 6% range .
- Here are my suggestions: The pie charts depict the average amount of money citizens spent on different categories in between 1950 and 2010.
- [It is not between the two dates but on those two date s] The greatest o verall change , it is immediately apparent that while housing was the largest expenditure spent the most in 1950, food was became the biggest segment in 2010.
- Additionally, all the figures categories witnessed dramatic changes during the given period, except for education, which stayed in the 6% range .
- and housing .
- 1%.
Get the Weekly English Kit 📬
New words, one handy idiom, and a 2-minute quiz — delivered to your inbox to keep your streak alive.
Here are my suggestions:
The pie charts depict the average amount of money citizens spent on different categories in between 1950 and 2010. [It is not between the two dates but on those two dates]
The greatest overall change , it is immediately apparent that while housing was the largest expenditu
 Related Questions