
Please check this.
Topic: The pie chart shows the amount of money that a children’s charity located in the USA spent and received in 2016.
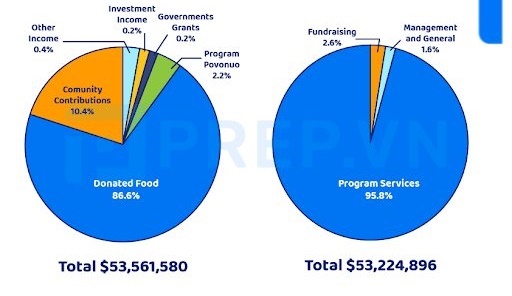
The pie charts give information about the revenue and expenditure of a US children’s charity in the year 2016.
Overall, while the revenue sources of the charity mainly came from donated food, the expenditure was mostly from program services. In addition, the total amount of money received and consumed was $53,561,580 and $53,224,896, respectively.
In terms of the amount of money earned, the donated food constantly took up 86.6%, contributing the most to the revenue of the charity. In the second place, the community contribution only accounted for 10.4 %, which was one-eighth compared to the first position. For other categories ( investment income, government grants, program povonuo, and other income), their total revenues only made up about 3% of the overall charity’s sales.
With regards to how the charity allocated the money, 95.8% of the total was used for operating program services. Meanwhile, the remaining 4.2% came from fundraising (2.6%) and management and general (1.6%).
Top answer
) pie charts give information about (Vague. Avoid "information about". It is not specific.
- ) pie charts give information about (Vague.
- Avoid "information about".
- It is not specific.
- ) of a US children’s charity in the year 2016.
- ) Overall, while the revenue sources of the charity mainly came from donated food, the expenditure s were was mostly from for program services.
Get the Weekly English Kit 📬
New words, one handy idiom, and a 2-minute quiz — delivered to your inbox to keep your streak alive.
The (How many???) pie charts give information about (Vague. Avoid "information about". It is not specific. The data is very specific.) a breakdown of the revenue and expenditures (There is more than one expenditure.) of a US children’s charity in the year 2016. (What are the categories?)
Overall, while th
 Related Questions