
Please check task 2 ielts (bar chart)
Topic: The bar chart below shows the amount of money invested in each category from five organisations.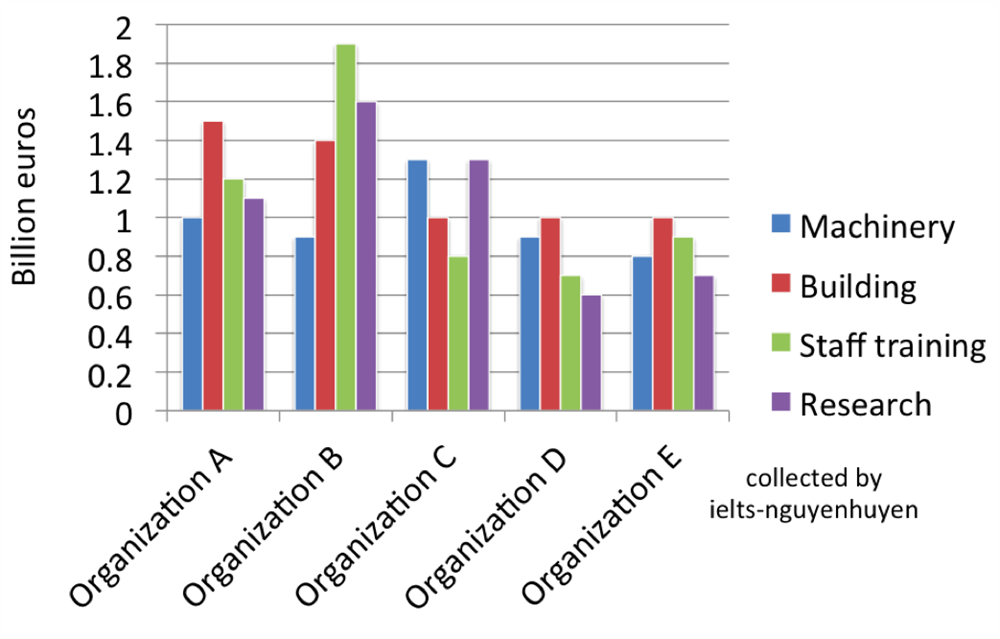
The bar chart compares how much money is spent on 5 different categories by 5 variety of organizations.
Overall, it can be seen that organization B spends a higher budget on these categories compared to the others, while organization D and E invest the least. In addition, The spending of organization C concentrates on Research and Machinery rather than Building and Staff training as the remaining ones.
Looking at organizations A and B, organization B invests the highest amount of money on Staff training, at 1.9 billion euros, which was about 5 and 3 billion euros higher than in comparison with that of building and research. Meanwhile, the largest amount of money is spent on the building by organization A, at 1.5 billion euros. And both organizations A and B spend the least amount of money on Machinery, at 1 and 0.9 billion euros respectively.
Turning to organizations D and E, there was an equal budget of expenditure on Building with 1 billion euros and the least spending on Research was 0.6 and 0.7 billion euros in organizations D and E respectively. Furthermore, organization C allocates 1.5 billion euros on both Research and Machinery while the other organizations have less investment with these categories.
Top answer
The bar chart compares how much money is spent (Wrong word. Spending is different from investing. They are not close synonyms.
- The bar chart compares how much money is spent (Wrong word.
- Spending is different from investing.
- They are not close synonyms.
- ) on 5 (wrong word.
- ) of organizations.
Get the Weekly English Kit 📬
New words, one handy idiom, and a 2-minute quiz — delivered to your inbox to keep your streak alive.
The bar chart compares how much money is spent (Wrong word. Spending is different from investing. They are not close synonyms. ) on 5 (wrong word. Also, spell out small numbers that are not data values.) different categories by 5
 Related Questions