
Please check task 1
The given graph illustrates the proportion of total global production in Asia, Europe and the rest of the world from 1840 to 2000
Overall, it can be seen that Asia ranked as first through the given period. While the production in Asia and Europe decreased, other countries witnessed a significant growth
In 1840, just over half of the global production came from Asia and Europe was in the second with 39% . Also, the equivalent for the rest of the world was only 10%. Forty years later, the figure for Europe remained constant while the percentage of the rest of the world overtook that of Asia, at 33% compared to 28%
In 1960, the proportion of global production in Asia and the rest of the world saw a slightly rise to 30% and 36%, respectively. By contrast, the equivalent for Europe continued to fell to around 30% by 2000. At the end of the period, the total of world production in Asia rose sharply to 46%, compared with a huge decline in the percentage of the rest of the world (24%)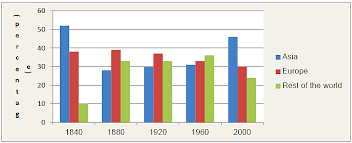
Get the Weekly English Kit 📬
New words, one handy idiom, and a 2-minute quiz — delivered to your inbox to keep your streak alive.
 Related Questions