
Please check task 1
The line graph illustrates the proportion of people who were born in UK, Asia and other regions resident in Australia over a 35 year period.
Overall, the percentage of resisents in the UK fell over the period while the proportion of people who were born in Asia rose sharply.
In 1976, UK residents stood at 14%, compared with 12% from other regions and 3% from Asia. The figure for those born in UK and other areas experienced a considerable decrease in 1986, at 10% and 8% respectively. In contrast, Asia residents increased significantly to reach 15% by the end of the period. Moreover UK residents continued to decline until 2011, at 5% while the figure for people who were born in other regions grew steadily to reach 14% in 2006 and there were a slight fall in 2011.
The percentage of the total Australia population stood at around 23% in 1976. However these figures fell to 21% in 2001 and then increased to 25% in 2011, accounted for one quarter of the Australia population.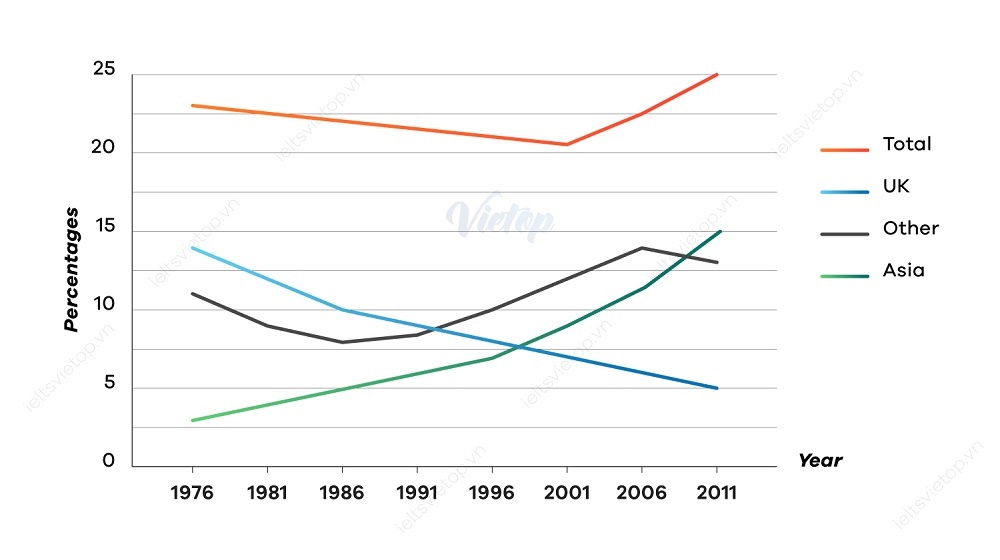
Top answer
The line graph tracks illustrates [ 1] the proportion of people who were born in [ 2] the UK, Asia [ 3] and or other regions , resident in Australia over a 3 5-y ear period (1976-2011) . Overall, the percentage of resisents in the UK - born residents fell over the perio d, while the proportion of people who were born in Asia rose sharply. In 1976, [ 4] UK - born residents stood at accounted for 14%, compared with 12% from other regions and 3% from Asia.
- The line graph tracks illustrates [ 1] the proportion of people who were born in [ 2] the UK, Asia [ 3] and or other regions , resident in Australia over a 3 5-y ear period (1976-2011) .
- Overall, the percentage of resisents in the UK - born residents fell over the perio d, while the proportion of people who were born in Asia rose sharply.
- In 1976, [ 4] UK - born residents stood at accounted for 14%, compared with 12% from other regions and 3% from Asia.
- The figure for those born in the UK and other areas experienced a considerable decrease in 1986, at down to 10% and 8% respectively.
- In contrast, the proportion of Asia n-born residents increased significantly to reach 15% by the end of the period.
Get the Weekly English Kit 📬
New words, one handy idiom, and a 2-minute quiz — delivered to your inbox to keep your streak alive.
The line graph tracks illustrates [ 1] the proportion of people who were born in [ 2] the UK, Asia [ 3] and or other regions, resident in Australia over a 3
 Related Questions