
Please check my writing task1. thank you so much.
The graph shows information about international conferences in three capital cities in 1980 – 2010.
Summarise the main character and make a comparison where relevant.
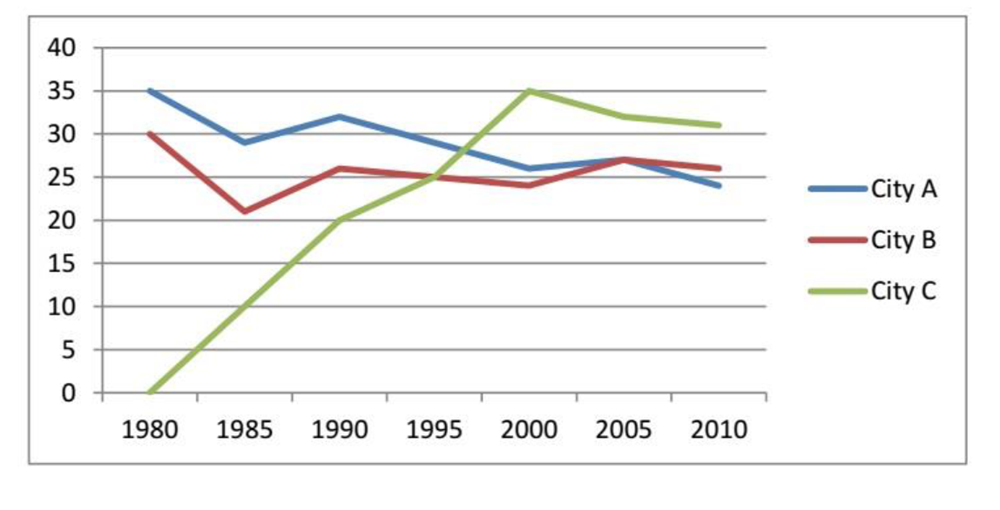
The line graph compares how many international conferences were hosted in three distinct capital cities namely A, B and C over three decades, starting in 1980.
Overall, the number of international conferences was on a downward trend in city A and B with the exception of city C, which showed a rapid increase during the period.
In 1980, the highest number of international conferences organized was 35 in city A, compared to 30 in city B. In 2005, both cities hosted the same number of international conferences with 27 events after a decrease of 8 and 3 events in city A and city B respectively from 1980 to 2005. By the year 2010, conferences hosted in city B had overtaken the number in city A and reached to 26. Meanwhile, there was a decline of 3% in the number of conferences hosted in city A, ending at 24.
During the same period, city C held no international conferences in 1980. The number of conferences rose dramatically to 20 in 1990 and then reached a peak of 35 in 2000. At the end of the period, although this value dropped to 31, it remained higher than city A’s and city C’s.
Top answer
The line graph compares how many international conferences were hosted in three distinct capital cities namely A, B and C over three decades, starting in 1980. Overall, the number of international conferences was on a downward trend i n city A and B with the exception of city C, which showed a rapid increase during the period. Incorrect phrasing..
- The line graph compares how many international conferences were hosted in three distinct capital cities namely A, B and C over three decades, starting in 1980.
- Overall, the number of international conferences was on a downward trend i n city A and B with the exception of city C, which showed a rapid increase during the period.
- Incorrect phrasing..
- Here are options: 1.
- Overall, the number of international conferences was on a downward trend in all three cities, with the exception of city C, which showed a rapid increase during the first two decades.
Get the Weekly English Kit 📬
New words, one handy idiom, and a 2-minute quiz — delivered to your inbox to keep your streak alive.
The line graph compares how many international conferences were hosted in three distinct capital cities namely A, B and C over three decades, starting in 1980.
Overall, the number of international conferences was on a downward trend in city A and B with the exception of city C, which showed a rapid increase during the period.
I
 Related Questions