
Please check my writing task1
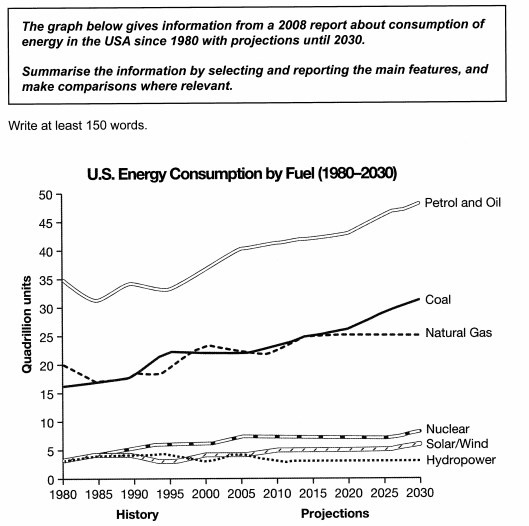
The line graph shows how people in the USA consume energy. Historical data started from 2008 until the present day and will project future until 2030. the six fuel groups are petrol and oil, coal, natural gas, nuclear, solar/wind, and hydropower.
Overall, using petrol and oil has the highest amount in all the years of this period. Coil and natural gas are the second energy consumption. Consuming of the other energies are not high such as petrol and oil, coil and natural gas.
Petrol and oil were used 35 (Quadrillion units) in 1980, although the figure had fluctuation from 1980 until 2005, It increased gradually and is projected to reach about 45 in 2030.
In 1980, the consumption of coal was about 16(Quadrillion units) and natural gas about 20. Although they had fluctuation in this period, in present have the same level, approximately 25 and they are projected in 2030, coal reach about 30 and natural gas about 25. Other source of energy started at about 3 and have not significantly changed between 1980 and 2030.
Top answer
The line graph shows how people in the USA consume energy . ) until the present day and will project future (ungrammatical) until 2030. the (wrong capitalization) six fuel groups are petrol and oil, coal, natural gas, nuclear, solar/wind, and hydropower.
- The line graph shows how people in the USA consume energy .
- ) until the present day and will project future (ungrammatical) until 2030.
- the (wrong capitalization) six fuel groups are petrol and oil, coal, natural gas, nuclear, solar/wind, and hydropower.
- Model paragraph: The line graph shows the amounts of six different types of fuel that were consumed in the US to produce energy from 1980 to the present day, with a forecast to 2030.
- The six fuel types are petrol and oil, coal, natural gas, nuclear, solar/wind, and hydropower.
Get the Weekly English Kit 📬
New words, one handy idiom, and a 2-minute quiz — delivered to your inbox to keep your streak alive.
The line graph shows how people in the USA consume energy. (That is not what the graph shows.) Historical data started from 2008 (That is not the earliest date on the graph.) until the present day and will project future (ungrammatical)
 Related Questions