
Please check my writing task1
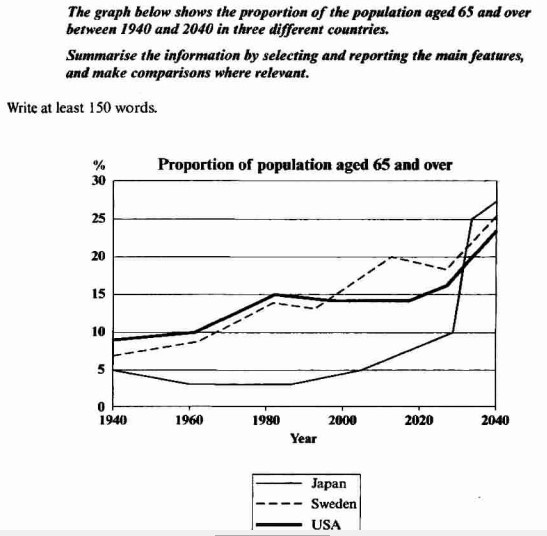
The line graph gives information about the percentage of ageing population in Japan, Sweden, and the USA from 1940 to 2040.
Overall, the percentage of elderly people in all three countries is expected to increase by almost 20% in 2040.
In 1940, the proportion of the population aged 65 and over started at 5% in Japan, approximately 7% in Sweden and 9% in the USA. Although the percentage of ageing population in the USA and Sweden increased by about 6% in 1980, the percentage of elderly people in Japan decreased and reached the lowest amount at almost 3% in this year.
In spite of some fluctuation in percentage of ageing population in the USA and Sweden, probably their percentage will continue to rise next decades. After 1980, the proportion of the population aged 65 and over in Japan increased and significantly grow is expected between 2030 and 2040 and reach about 27%.
Top answer
The line graph gives information about (That is very vague. ) the percentage of ageing population in Japan, Sweden, and the USA from 1940 to 2040. (You need to be more precise and exact when you describe a mathematical diagram.
- The line graph gives information about (That is very vague.
- ) the percentage of ageing population in Japan, Sweden, and the USA from 1940 to 2040.
- (You need to be more precise and exact when you describe a mathematical diagram.
- g.
- The line graph plots the percentage of a country's population who were over age 65.
Get the Weekly English Kit 📬
New words, one handy idiom, and a 2-minute quiz — delivered to your inbox to keep your streak alive.
The line graph gives information about (That is very vague. What data is plotted?) the percentage of ageing population in Japan, Sweden, and the USA from 1940 to 2040.
(You need to be more precise and exact when you describe a mathematical diagram. e.g.
The line grap
 Related Questions