
Please check my writing task 1. Thank you so much
The chart below shows the percentage of difference in income between men and women from 1978 to 2008. Summarize the information by selecting and reporting the main features, and make comparisons where relevant.
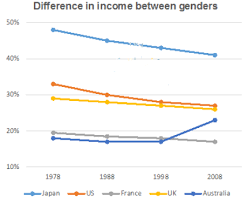
The line graph compares male and female in terms of the percentage of their income gap over a period of 20 years starting from 1978.
Overall, the difference in earnings between men and women in Japan, the US, the UK, and France registered a downward trend for most of the period with the exception of that in Australia. In Japan, male’s income was more different than female’s out of in four countries surveyed.
In 1978, the percentage of the income gap between genders started at 50% in Japan, higher than in the US at approximately 35%. This of these two countries continued to decrease sharply to about 40% for the former and 27% for the latter in 2008.
During the same period, the remaining countries constituted a small fraction. The percentage of the income gap between men and women in the UK was 30% in 1978, compared to 20% and 18 % in France and Australia respectively. Then the percentage declined gradually to 26% in the UK and 18% in France in 2008. In contrast, the comparable value for Australia showed a rise of 10% from 1978 to 2008, ending with 25%.
Top answer
The line graph compares male and female (wrong form) in terms of the percentage of their income differences gap over a period of 20 years starting from 1978. (Incomplete opening paragraph. You must mention the five countries and their names.
- The line graph compares male and female (wrong form) in terms of the percentage of their income differences gap over a period of 20 years starting from 1978.
- (Incomplete opening paragraph.
- You must mention the five countries and their names.
- ) Overall, the difference in earnings between men and women in Japan, the US, the UK, and France registered was on a downward trend for most of the period with the exception of that in Australia.
- In Japan, male’s income was more different than female’s out of in four countries surveyed .
Get the Weekly English Kit 📬
New words, one handy idiom, and a 2-minute quiz — delivered to your inbox to keep your streak alive.
The line graph compares male and female (wrong form) in terms of the percentage of their income differences gap over a period of 20 years starting from 1978. (Incomplete opening paragraph. You must mention the five countries and their names. Otherwise the reader is very confuse
 Related Questions