
Please check my writing task 1. thank you so much
The charts below show the main reasons for the study among students of different age groups and the amount of support they receive from employers.
Summarise the information by selecting and reporting the main features, and make comparisons where relevant.
» You should write at least 150 words.
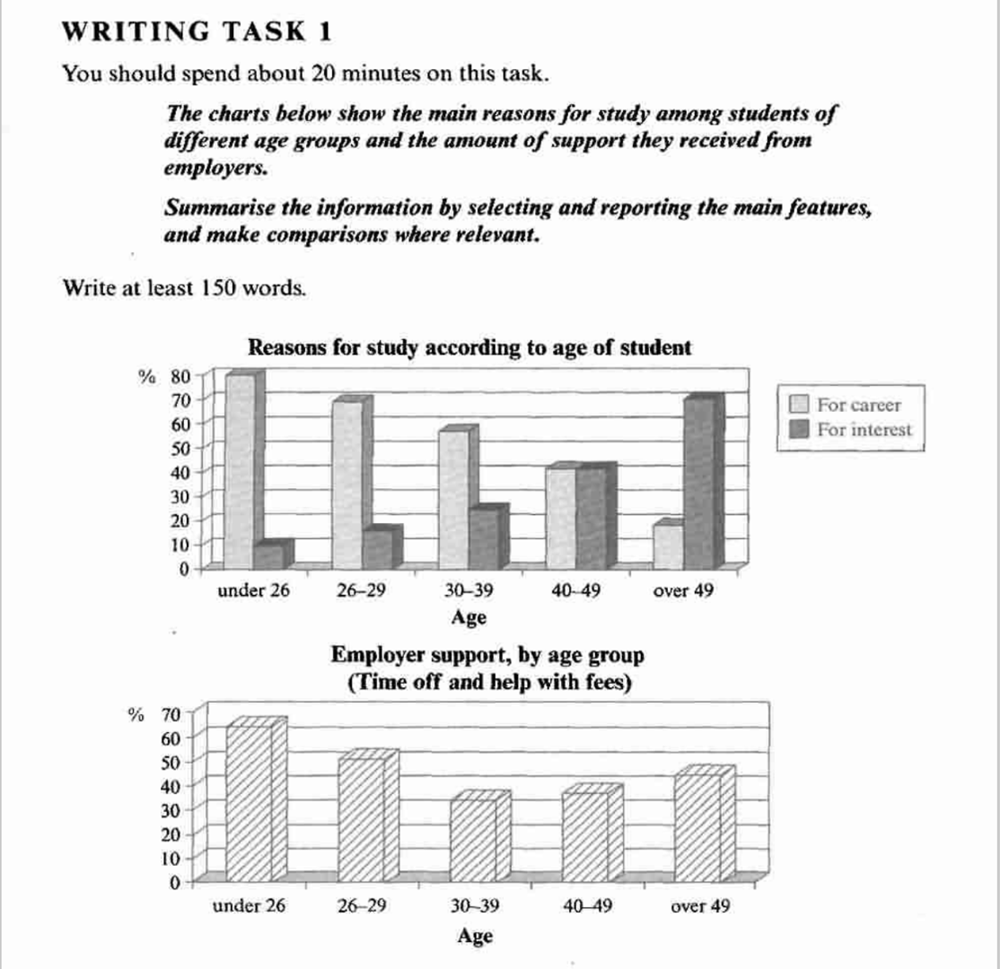
The first bar chart compares students of different ages in terms of the reasons why they study for a professional career or personal interest. The second chart illustrates the employer support per age group.
Overall, while the under 26 age group study for passion, the oldest group study out of pure interest. The youngest students receive the most support from employers.
For every 10 students under 26, the reason 8 students study is their personal interest, the only one students study to advance a career. The gap between the proportion narrow from students under 26 to those in their 30s and become equal in their 40s. 70% of those aged 50 or above study for interest, compared with less than 20% who pursue career-related studies.
The under 26 age group is the highest percentage of the given more time off and help with fees, whereas the opposite is true for those in their 30s at only 35%. However, of those students aged 40-49 and over 50, who receive employer support 38% and 45% respectively.
Top answer
The first bar chart compares students of different ages in terms of the two reasons why they study : for their career or for interest. for a professional career or personal interest. The second bar chart illustrates the employer support per age group.
- The first bar chart compares students of different ages in terms of the two reasons why they study : for their career or for interest.
- for a professional career or personal interest.
- The second bar chart illustrates the employer support per age group.
- (Your paragraph is not complete.
- What are the age groups?
Get the Weekly English Kit 📬
New words, one handy idiom, and a 2-minute quiz — delivered to your inbox to keep your streak alive.
The first bar chart compares students of different ages in terms of the two reasons why they study: for their career or for interest. for a professional career or personal interest. The second bar chart illustrates the employer support per age group. (
 Related Questions