
Please check my Writing task 1. Thank you :)
The first bar chart compares England with its capital in terms of average house prices in 1995 and 2013. The second graph shows the differences in house prices over six different areas of England in 2013.
Overall, people living in the capital of London had to pay a plethora of money for accommodation compared to the country's average house price. Another striking feature is that houses in London cost the most, whereas the least expensive ones are in the North East.
In detail, the average price of a house in London was 200,000 pounds, which was higher than that of London, at about 130,000 pounds. The difference in house value in London and England was even more significant in 2013, when the house price of London surged to 420,000 pounds, more than double the country’s average.
The expenditure of houses in London was recorded to be at the top of the list, a high of 400,000 pounds in 2013 compared to other areas. The money spent for houses in the South East and the South West ranked second and third places, at around 310,000 and 260,000 pounds respectively. In contrast, housing prices were more affordable for people living in the Midlands and North East, at only around a mere 100,000 pounds.
(203 words)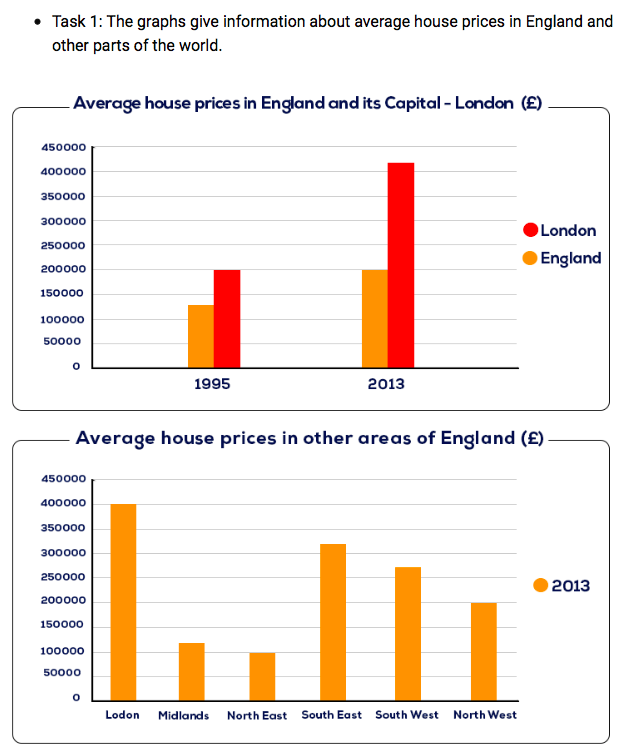
Top answer
The first bar chart compares England with its capital in terms of average house prices (unnatural) in 1995 and 2013. ) shows the differences in house prices over six different areas of England in 2013. ) Overall, people living in the capital of London had to pay a plethora of (very bad - wrong words and they are very informal ) money for accommodation compared to the country's average house price.
- The first bar chart compares England with its capital in terms of average house prices (unnatural) in 1995 and 2013.
- ) shows the differences in house prices over six different areas of England in 2013.
- ) Overall, people living in the capital of London had to pay a plethora of (very bad - wrong words and they are very informal ) money for accommodation compared to the country's average house price.
- ) feature is that houses in London cost the most, whereas the least expensive ones are in the North East.
- ) at about 130,000 pounds.
Get the Weekly English Kit 📬
New words, one handy idiom, and a 2-minute quiz — delivered to your inbox to keep your streak alive.
The first bar chart compares England with its capital in terms of average house prices (unnatural) in 1995 and 2013. The second graph (What kind of graph?) shows the differences in house prices over six different areas of England in 2013. (What are these areas?)
Overall, pe
 Related Questions