
Please check my Writing task 1. Thank you
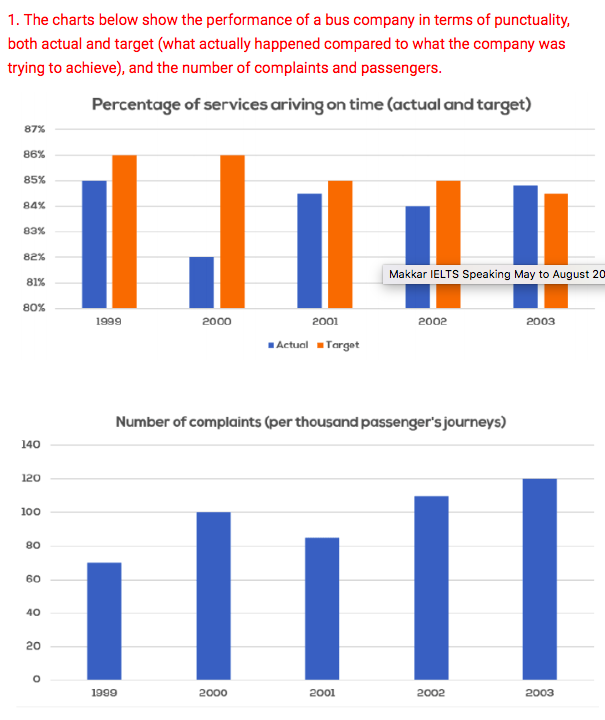
The two bar charts give information about the actual and target percentage of buses, from a particular bus company that arrived at the destination on time and a number of complaints made by passengers in the period of 5 years, from 1999 to 2003.
It is clear that while the percentage of services arriving on time target generally decreased, the opposite was true for the number of complaints over the period. Another striking feature is that the bus company seems to fail to achieve their target in 5 years except for 2003.
Even though the company set their highest punctuality aim in 1999 and 2000, which was 86%, they didn’t reach its target which was at 85% and 82% respectively. It also reflected the number of complaints from passengers which was approximately 63.000 in 1999 and 100.000 in 2000.
In the next three years, the bus company tried to lower their aim, at only 85% in 2001 and 2002 and approximately 85% in 2002. As a matter of fact, they were close to achieve their goal in 2001, with a low of 85%. The percentage of actual on-time arrivals underwent a significant decrease to 84% in 2001, then increased to exceed the target of 85% in 2003. In contrast, the number of complaints rose significantly from 82.000 in 2001 to its highest point in 5 years at 120.000 in 2003.
(228 words)
Top answer
The two bar charts give information about (vague. Tell the reader what is plotted. ) the actual and target percentage of buses , (awkward) from a particular bus company that arrived at the destination on time and a number of complaints made by passengers in the period of 5 years , from 1999 to 2003.
- The two bar charts give information about (vague.
- Tell the reader what is plotted.
- ) the actual and target percentage of buses , (awkward) from a particular bus company that arrived at the destination on time and a number of complaints made by passengers in the period of 5 years , from 1999 to 2003.
- ) while the percentage of services arriving on time target generally decreased, the opposite was true for the number of complaints over the period.
- (This is very awkward) Another striking feature is that the bus company seems (There is no "seem" in math!
Get the Weekly English Kit 📬
New words, one handy idiom, and a 2-minute quiz — delivered to your inbox to keep your streak alive.
The two bar charts give information about (vague. Tell the reader what is plotted. "Give information about" is not clear.) the actual and target percentage of buses, (awkward) from a particular bus company that arrived at the destination on time and
 Related Questions