
Please check my writing task 1.
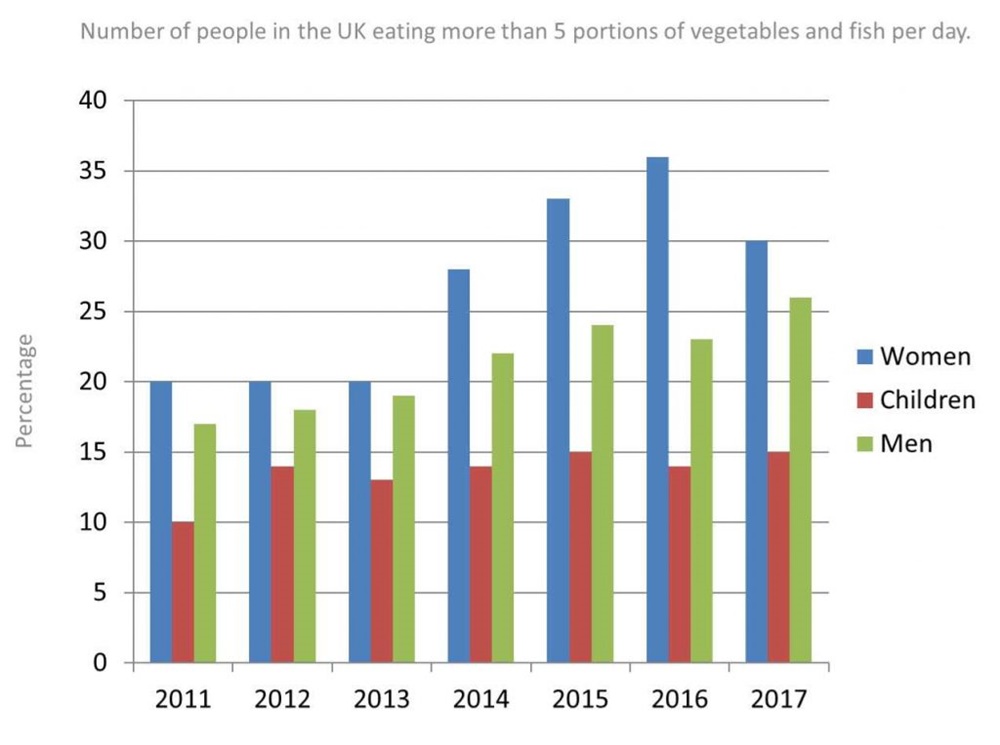
The time clustered bar chart compares the percentage of people in the UK consuming more than 5 portions of vegetables and fish per day from 2011 to 2017. Three categories of subject conveyed include: women, men and children.
Overall, the percentage of women is higher than that of men and children each year, while children had the lowest proportion of all the three categories. The last three years saw the significant increase of figure for men and women to over one in five and one in four, respectively.
In detail, between 2011 and 2013, the percentage of women remained unchanged. In 2011, only 10% of children ate more than 5 portions of vegetables and fish per day, whereas the proportion of men stood at around 17%. From 2014 to 2016, the figure for women increased to reach a peak of 36%, although there was a drop to 30% one year later. During the period shown, there was an gradual rise in the proportion for men, and the outlier was 2016. The period from 2011 to 2017 saw a slight fluctuation in the percentage of children, between 10% and 15%.
Get the Weekly English Kit 📬
New words, one handy idiom, and a 2-minute quiz — delivered to your inbox to keep your streak alive.
 Related Questions