
Please check my writing task 1
The line graph illustrates the tendency of population statistic in Scotland from 1940 to 2020. It is clear that the percentage of the death rate is only rising while the proportion of birth rate and population extend decreased.
The proportion of deaths started at 1.5 percent before there was a drop significantly in the next twenty years at 0.5 percent. However, the demise rate unchanged until it went down slightly with 0.3 percent in 1980. After that, the rate of death was stable again for twenty years and then it increased dramatically in the next two decades with almost 1.0 percent in 2020.
In contrast, the percentage of birth and population extend stood at 2.5 percent and nearly 1.0 respectively in 1940. Thereafter, the figure dropped slightly in 1945 before it peaked at over 2.0 percent for birth rate and 1.5 percent for population growth rate. Moreover, the rate of two categories fluctuated in the following fifteen years. After that, the rate of resident extends
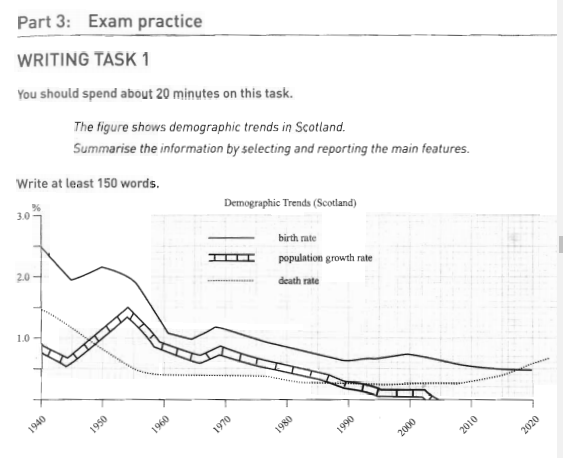
decreased to 0 percent until 2005 whereas the rate of birth went down slightly at 0.5 percent in 2020.
P/s: If you think some words or sentences should be changed, please make suggestions to help me improve my writing skill.
Top answer
The line graph illustrates gives / shows / plots / depicts the tendency of population statistic (Completely wrong. ) in Scotland from 1940 to 2020. ) It is clear that the percentage of the death rate (no, no, no!.
- The line graph illustrates gives / shows / plots / depicts the tendency of population statistic (Completely wrong.
- ) in Scotland from 1940 to 2020.
- ) It is clear that the percentage of the death rate (no, no, no!.
- ) is only rising while the proportion (wrong word.
- ) of birth rate and population extend (wrong word) decreased.
Get the Weekly English Kit 📬
New words, one handy idiom, and a 2-minute quiz — delivered to your inbox to keep your streak alive.
The line graph illustrates gives / shows / plots / depicts the tendency of population statistic (Completely wrong. ) in Scotland from 1940 to 2020. (You must begin a new paragraph when you stop describing the figure and begin to write about the main features.) It is clear that the
 Related Questions