
Please check my writing task 1
The pie charts below show electricity generation by source in New Zealand and Germany in 1980 and 2010. Summarize the information by selecting and reporting the main features, and make comparisons where relevant.
The pie charts compare New Zealand and Germany in terms of the sources of electricity between 1980 and 2010.
Overall, the total unit of sources in 2010 was almost double that in 1980 in both nations. In 2010, most electricity was produced by nuclear power in Germany and by coal in New Zealand.
In 1980, coal was the main source of electricity in New Zealand, which was twice the figure for Germany with 28 units. By contrast, the electricity generated by petroleum was 22 units in Germany and 11 units in New Zealand. While hydro and natural gas each accounted for 30 units in New Zealand, the figure for natural gas, nuclear and hydropower in Germany were 28 units, 20 units, and only 7 units respectively.
In 2010, there were two principal sources of electricity production in New Zealand, coal (150 units) and hydro (46 units). Natural gas and petroleum totaled almost 5 units. Meanwhile, the main source of electricity production in Germany was nuclear which generated 155 units. Although the figures for natural gas and hydro fell to only 2 units, that for petroleum increased to 27 units. The figure for coal was a significant remain with 28 units.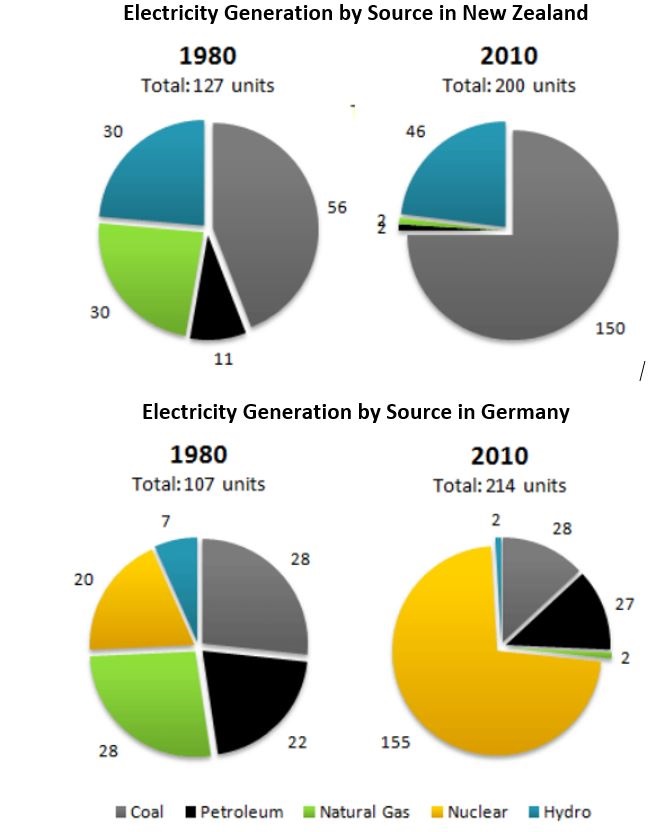
Top answer
I don't know where the data comes from, but it is in direct contradiction to the data on Wikipedia, which shows that in New Zealand electricity generation is well over 60% from hyrdro-power. org/wiki/Electricity_sector_in_New_Zealand
- I don't know where the data comes from, but it is in direct contradiction to the data on Wikipedia, which shows that in New Zealand electricity generation is well over 60% from hyrdro-power.
- org/wiki/Electricity_sector_in_New_Zealand
Get the Weekly English Kit 📬
New words, one handy idiom, and a 2-minute quiz — delivered to your inbox to keep your streak alive.
I don't know where the data comes from, but it is in direct contradiction to the data on Wikipedia, which shows that in New Zealand electricity generation is well over 60% from hyrdro-power.
https://en.wikipedia.org/wiki/Electricity_sector_in_New_Zealand
By the way, in reality, nuclear power currently accounts for only 11.6% of electricity generated in Germany, but 71.6% in France. At the same time, coal accounts for more than 65% of total energy consumption in China. So the data on these pie charts is totally misleading, fake, and erroneous. Furthermore, to make a valid comparison of units between countries, the data would need to show per
 Related Questions