
Please Check My Writing Report In IELTS.
Topic: Writing task 1: The charts below show the results of a questionnaire that asked visitors to the Parkway Hotel how they rated the hotel's customer service. The same questionnaire was given to 100 guests in the years 2005 and 2010.
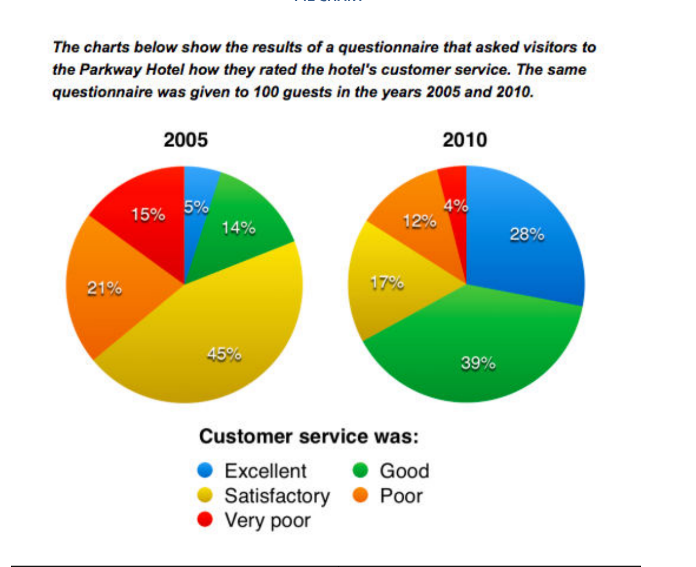
The pie charts indicate the responses of customers who experienced Parkway Hotel'service in 2005 and 2010.
It is clear that there was a significant improvement of service quality from 2005 to 2010. While the vast majority of people rated the custom service was satisfactory and poor, most customers gave feedback was excellent and good in 2010.
Looking at the positive datas first, in 2005 only 5% of the hotel'visitors rated custom service was excellent. This figure rose significantly and ended at 28% in 2010. Furthermore, while only 14% of guests responded to survey about customer service as good in 2005. 5 years later, almost three times as many people gave thi rating.
Turning to the remaining feed back, we can see that the percentage of people thought the custom service was poor decreased from 21% in 2005 to 12% in 2010. Similarly, the proportion of people considered the hotel'service to be very poor was 15% in 2005 and dropped to 4% in 2010. Finally, a fall in the number of satisfactory rating reflects to positive feedback given by people in that year.
Please read my advice for Task 1 essays. Thank you so much!
Top answer
) of customers who experienced wrong word. We do not experience a service. ) Parkway Hotel'service (wrong format, spelling and spacing errors) in 2005 and 2010.
- ) of customers who experienced wrong word.
- We do not experience a service.
- ) Parkway Hotel'service (wrong format, spelling and spacing errors) in 2005 and 2010.
- Suggested opening: In the first paragraph you describe the figure precisely and exactly so that the reader knows you have understood the task.
- The two pie charts, labelled 2005 and 2010, give the proportion of Parker Hotel guest's answers on a survey of the quality of the hotel's customer service department.
Get the Weekly English Kit 📬
New words, one handy idiom, and a 2-minute quiz — delivered to your inbox to keep your streak alive.
The (How many?the ) pie charts indicate the responses (What are the types of responses?) of customers who experienced wrong word. We do not experience a service. ) Parkway Hotel'service (wrong format, spelling and spacing
 Related Questions