
Please check my WRITING IELTS TASK 1 and give me my band score for this task.Thank you.
WRITING TASK 1
You should spend about 20 minutes on this task.
The chart below shows the proportions of adults in Canada who own one car, two cars, more than two cars, or who do not own a car.
Summarise the information by selecting and reporting the main features and make comparisons where relevant.
You should write at least 150 words.
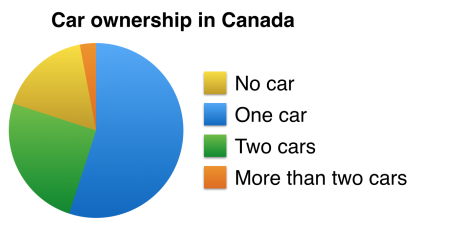
The pie chart illustrates the percentage of Canadian people whose the number of cars ranges from zero to more than two cars.
Overall, most of the people own cars accounting for approximately more than 85%. The largest contribution is made by adults who own a car and the smallest belongs to people who own more than two cars.
The car ownership is divided into three categories: one car, two cars and more than two cars.Taking the first the position is the one-car ownership amounting to more than half of the survey.The possession of two cars becomes the decision of 30% investigated. The proportions of people who using more than two cars in Canada is very little. They just account for 5%. Besides the number of adults having cars is significant, there are a small quantity having no cars. This part is only nearly 15% of the whole percentage of Canadians.
Top answer
The pie chart illustrates (wrong word. Illustrate means "make a picture". It is good for maps, process maps, and other drawings.
- The pie chart illustrates (wrong word.
- Illustrate means "make a picture".
- It is good for maps, process maps, and other drawings.
- It is not a good word for line graphs, bar charts and pie charts.
- ) the percentage of Canadian people whose the number (wrong expression) of cars ranges from zero to more than two cars.
Get the Weekly English Kit 📬
New words, one handy idiom, and a 2-minute quiz — delivered to your inbox to keep your streak alive.
The pie chart illustrates (wrong word. Illustrate means "make a picture". It is good for maps, process maps, and other drawings. It is not a good word for line graphs, bar charts and pie charts. ) the percentage of Canadian people whose the number (wrong expression) of cars ranges from z
 Related Questions