
Please check my writing for task 1
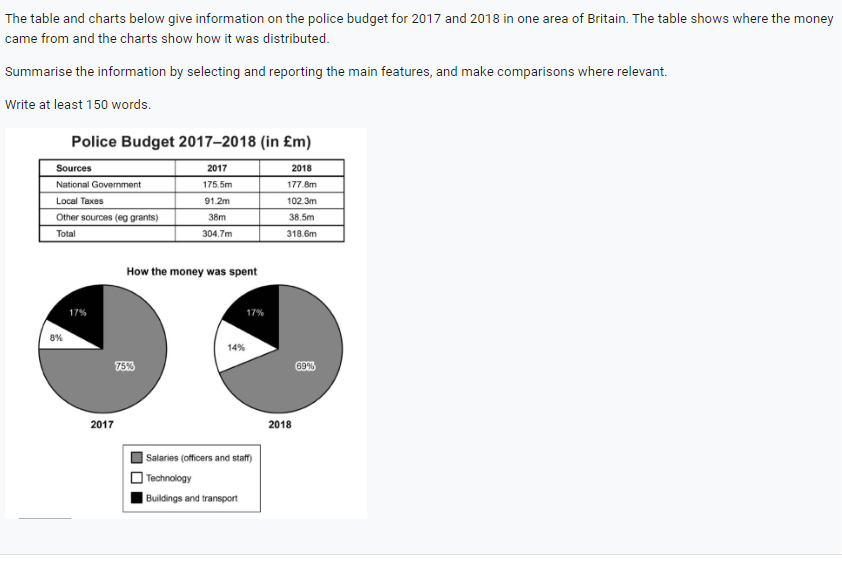
The table depicts which sources make up the police budget in 2007 and 2018 for a region of Britain. In addition, the pie charts illustrates where this budget was spent.
Overall, the most income to the police budget was provided by national gavernment, while the majority of this budget was allocated for salaries in each year.
As for table, there are three main supportive sources in police budget. National goverment had the biggest role in police budget with making up almost half of total sources in 2017 and 2018. Second to that, local taxes consisted of nearly a third of all sources. Moreover, other sources had the least contribution to all sources.
Regarding pie charts: salaries, technology, and buildings-transports were the main outcome fields. The largest fraction was for salaries which decreased from75% to 69% between 2018 and 2017. The other, buildings and transport remained the same in both years with 17%. Furthermore, the amount of money spending to technology from police budget increased by 6% during these two-year period.
Top answer
The table depicts which sources make made up the police budget in 2007 and 2018 for a region of Britain. In addition, the pie charts illustrates where this budget was spent. Overall, the most income funding to the police budget was provided by the national g o vernment, while the majority of this budget was allocated for salaries in each of those year s .
- The table depicts which sources make made up the police budget in 2007 and 2018 for a region of Britain.
- In addition, the pie charts illustrates where this budget was spent.
- Overall, the most income funding to the police budget was provided by the national g o vernment, while the majority of this budget was allocated for salaries in each of those year s .
- As for table, T here are were three main supportive sources in for the police budget.
- The n ational gover n ment had the biggest role in police budget with making up made the largest contribution, almost half of the total sources in 2017 and 2018.
Get the Weekly English Kit 📬
New words, one handy idiom, and a 2-minute quiz — delivered to your inbox to keep your streak alive.
The table depicts which sources make made up the police budget in 2007 and 2018 for a region of Britain. In addition, the pie charts illustrates where this budget was spent.
Overall, the most income funding to the police budget was provided by
 Related Questions