
Please check my writing for task 1
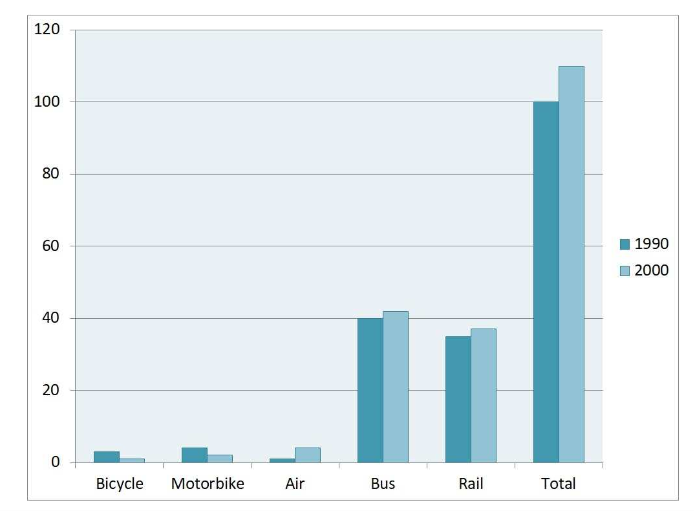
The chart illustrates distances traveled per person per week (in kilometers) in terms of 5 types of transport in the UK between 1990 and 2000.
The bar chart compares different kinds of transport used by a person in terms of distances traveled per week in kilometers in the UK in 1990 and 2000.
Overall, the distance gone with transportation vehicles went up from 1990 to 2000. In addition, the noticeable increase had air transportation in the same period.
As for vehicles having a decrease in distance, the number of kilometers by bicycle and motorbike decreased in 2000 compared with 1990. In 1990, the distance traveled per person per week by motorbike was nearly 5 km while that by bicycle was about 3 km. these km for motorbike and bcycle reduced to roughly 2 and 1 km after 10 years, respectively.
When it comes to transports traveled longer distance, bus traveled the longest distance in both 1990 and 2000 with 41 km on average. Following that, rail had nearly 38 km per person per week in 1990 and 2000. Moreover, the distance per person per week by bus and trail rose by 2 km from 1990 to 2000 as the same. The most remarkable change happened for air transport. While it had the least distance with 1 km in 1990, it became to travel 5 km per person per week in 2000.
Top answer
The [ 1] bar chart [ 2] illustrates compares five modes of transport in the UK in terms of distances traveled per person per week (in kilometers) in terms of 5 types of transport in the UK between in 1990 and 2000. The bar chart compares different kinds of transport used by a person in terms of distances traveled per week in kilometers in the UK in 1990 and 2000. Overall, the total distance gone with transportation vehicles went up , and bus and rail dominated in both years.
- The [ 1] bar chart [ 2] illustrates compares five modes of transport in the UK in terms of distances traveled per person per week (in kilometers) in terms of 5 types of transport in the UK between in 1990 and 2000.
- The bar chart compares different kinds of transport used by a person in terms of distances traveled per week in kilometers in the UK in 1990 and 2000.
- Overall, the total distance gone with transportation vehicles went up , and bus and rail dominated in both years.
- from 1990 to 2000.
- In addition, the noticeable increase had air transportation in the same period.
Get the Weekly English Kit 📬
New words, one handy idiom, and a 2-minute quiz — delivered to your inbox to keep your streak alive.
The [ 1] bar chart [ 2] illustrates compares five modes of transport in the UK in terms of distances traveled per person per week (in kilometers) in terms of 5 types of transport in the UK between in 1990 and 2000.
 Related Questions