
Please check my writing for task 1
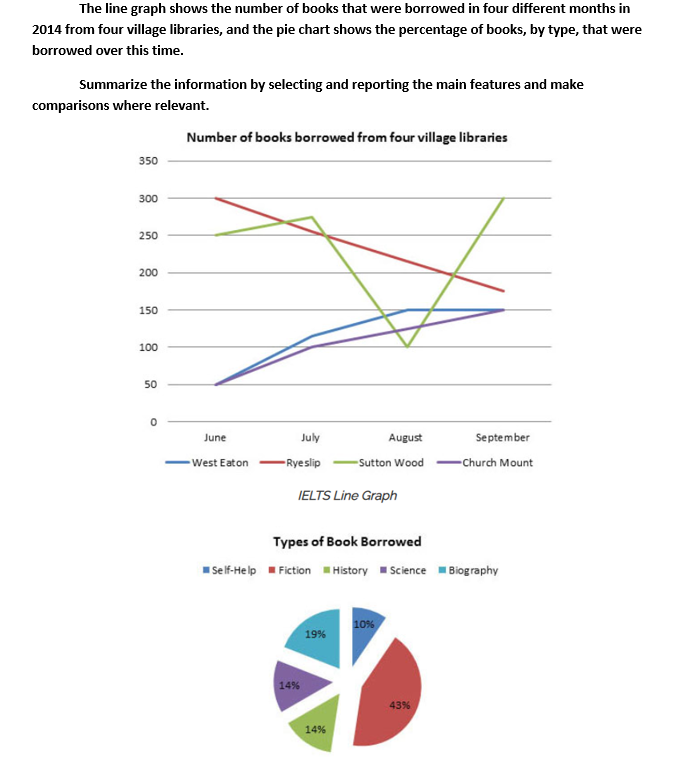
The line graph compares the number of books borrowed from four libraries, West Eaton, Rye slip, Sutton Wood, Church Mount, in the summer months and September. In addition, the pie chart plots the proportion of the books’ kinds that were borrowed during the-four-month period.
Overall, the number of borrowed books increased in all libraries except Rye slip over a couple of months and the most popular type of borrowed books was fiction, while the less one was self-help.
As for line graph, there are some diversity among all libraries about the proportion of borrowed books. The number of books which was borrowed in West Eaton and Church Mount libraries increased steadily and it almost doubled firstly in July and then tripled in September. In addition, it was borrowed 250 pieces in June and 270 in July after that declined dramatically to 100 finally reached to 300. Moreover, the count of borrowed books approximately halved over this period.
Regarding pie chart, the highest proportion of all kinds of books was the fiction with almost half. Second to that, biographic books were preferred with 19%. The proportion of borrowed historic and scientific books was the same with 14%. The lowest percentage of one borrowed was for self-help kind with a tenth.
Top answer
The line graph compares the number of books borrowed from four libraries, West Eaton, Rye slip , (one word) Sutton Wood, Church Mount, in the summer each of the months between June and September. In addition, the pie chart plots the proportion of the books’ kinds (Very awkward) divides the total number of these books into five types: Fiction, Self-help, Science, History and Biography. that were borrowed during the-four-month period .
- The line graph compares the number of books borrowed from four libraries, West Eaton, Rye slip , (one word) Sutton Wood, Church Mount, in the summer each of the months between June and September.
- In addition, the pie chart plots the proportion of the books’ kinds (Very awkward) divides the total number of these books into five types: Fiction, Self-help, Science, History and Biography.
- that were borrowed during the-four-month period .
- Overall, the number of borrowed books increased in all libraries except Rye slip over a couple of months (awkward, there are four not two, months.
- ) and the most popular type of borrowed books was fiction, while the less on e least popular was self-help.
Get the Weekly English Kit 📬
New words, one handy idiom, and a 2-minute quiz — delivered to your inbox to keep your streak alive.
The line graph compares the number of books borrowed from four libraries, West Eaton, Rye slip, (one word) Sutton Wood, Church Mount, in the summer each of the months between June and September. In addition, the pie chart plots the proport
 Related Questions