
Please check my writing !
The pictograph illustrates the information about the number of criminal in prisons in five different areas from the period of 1930 to 1980.
To begin, it can be seen that the number of criminal in United States in 1980 was the highest, at 140 thousands. The two next highest areas were the United States in 1940 and Canada in 1930, at 130 thousands and 120 thousands respectively, while Great Britain in 1930 was the lowest with only 30 thousands. In contrast, we can see that the figure in Great Britain, Australia and New Zealand levelled off at a peak of 80 thousands in 1970. Additionally, the proportion of criminal in Great Britain has soared significantly from 1930 to 1980, whereas it has plumged steadily. In 1950, the figure in Great Britain, Australia and New Zealand fluctuated around a peak of 50 thousands, but it erraticed from 62 thousands to 80 thousands in 1960.
Overall, it is evident that the number of criminal in United States and Canada were the largest. The countries in Europe and Oceania have less percentage in it.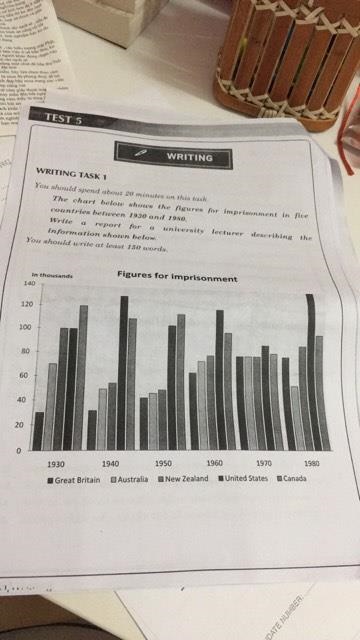
Top answer
Please review the use of plurals. That is where you have made the mot grammatical errors. The pictograph (??
- Please review the use of plurals.
- That is where you have made the mot grammatical errors.
- The pictograph (??
- ) from the period of 1930 to 1980.
- To begin, it can be seen that the number of criminal (That is not what the chart shows.
Get the Weekly English Kit 📬
New words, one handy idiom, and a 2-minute quiz — delivered to your inbox to keep your streak alive.
Please review the use of plurals. That is where you have made the mot grammatical errors.
The pictograph (?? It is not a pictograph.) illustrates the information about the number of criminal in prisons in five different areas (Be more specific.) from the period of 1930 to 1980.
To begin, it c
 Related Questions